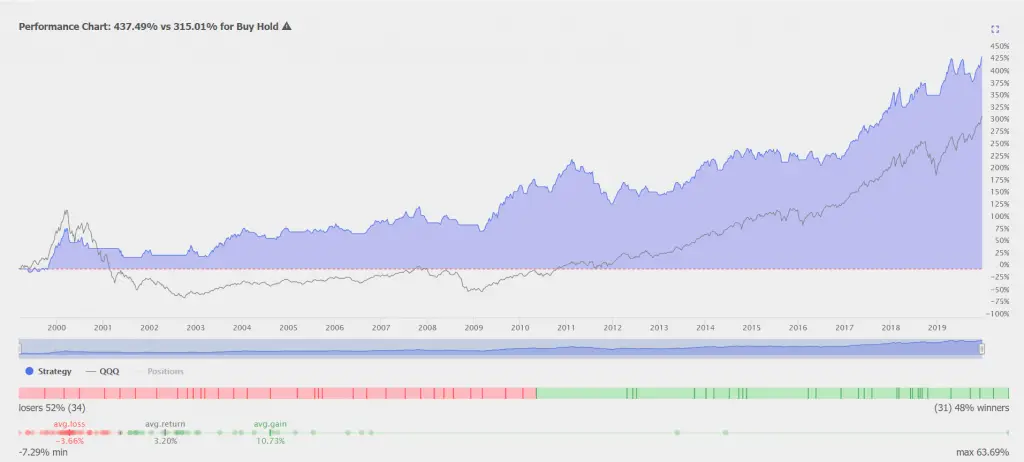
Moving averages are technical trading indicators for capturing trends. This post shows the backtesting data and system equity curve versus buy and hold using TrendSpider.com.
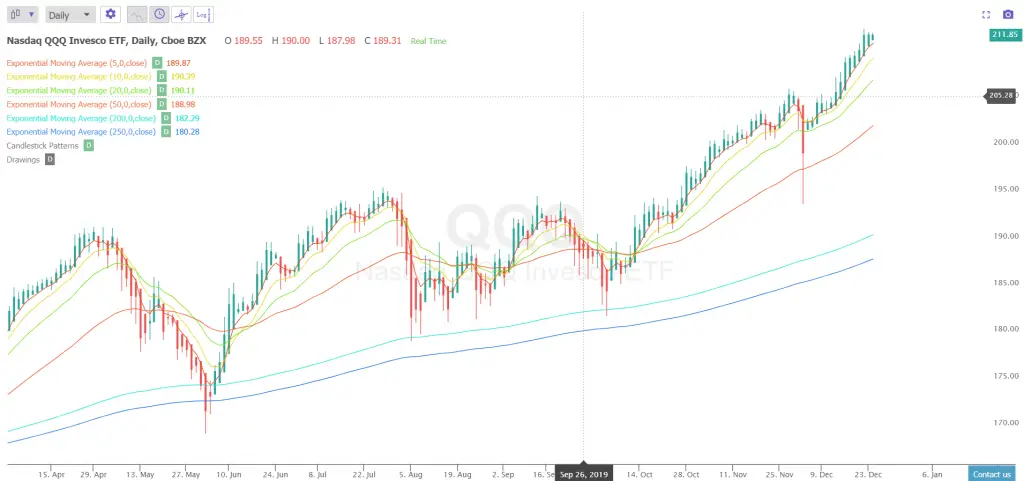
This is the backtest based on buying $QQQ when the 5 day EMA crosses and closes over the 20 day EMA and then selling when the 5 day EMA closes back under the 20 day EMA:
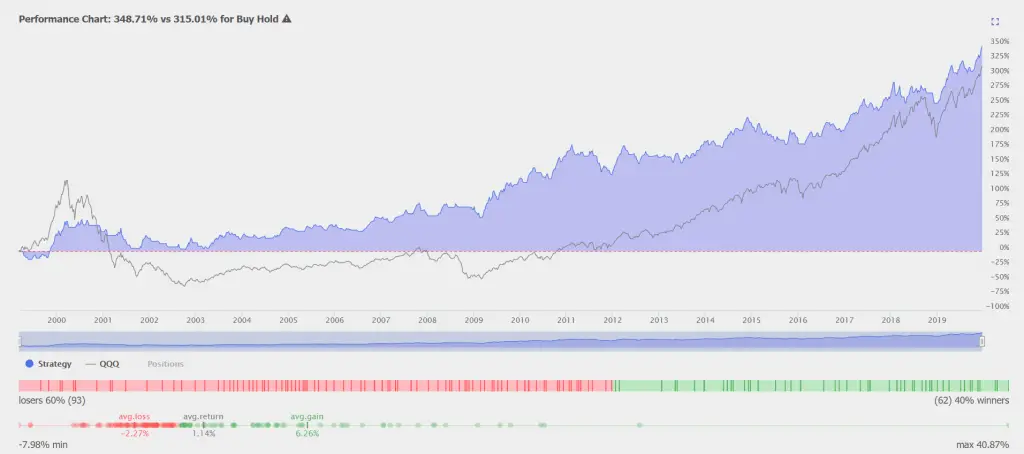
This is the backtest based on buying $QQQ when the 10 day EMA crosses and closes over the 50 day EMA and then selling when the 10 day EMA closes back under the 50 day EMA:
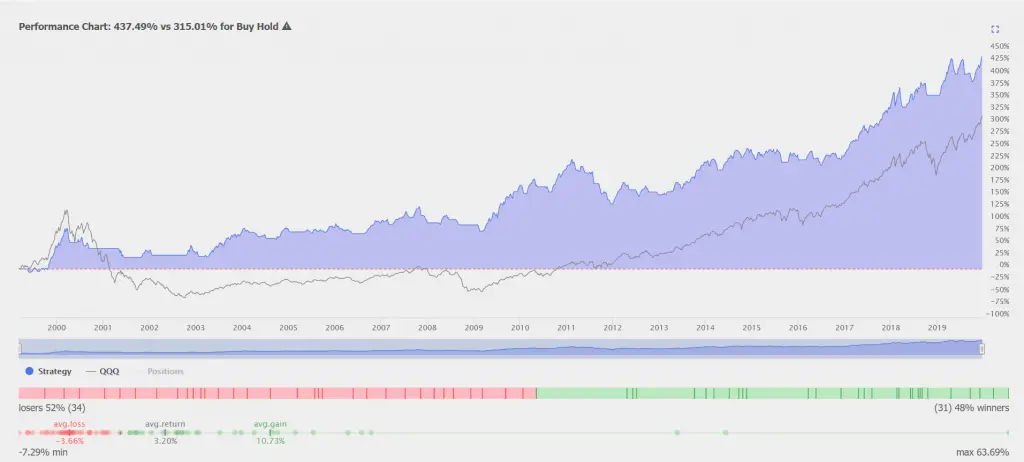
This is the backtest based on buying $QQQ when price closes over the 200 day EMA and then selling when price closes back under the 200 day EMA:
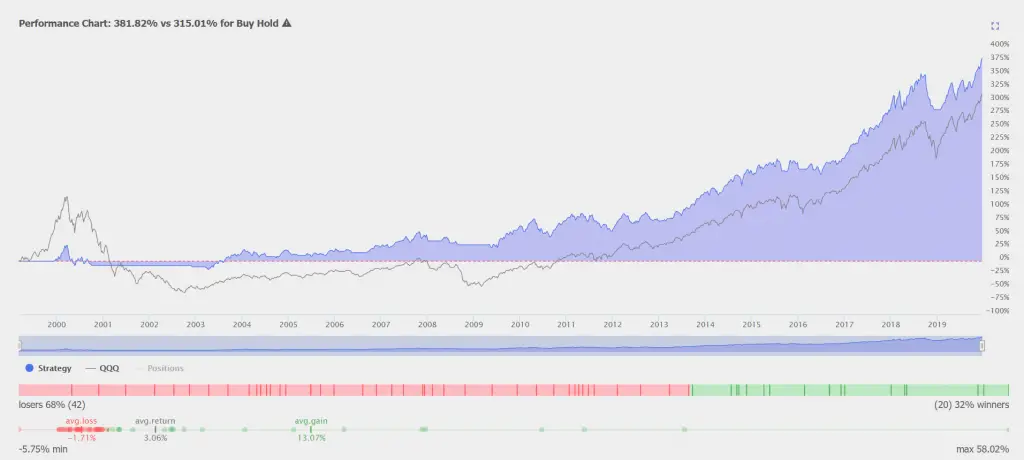
This is the backtest based on buying $QQQ when price closes over the 250 day EMA and then selling when price closes back under the 250 day EMA:
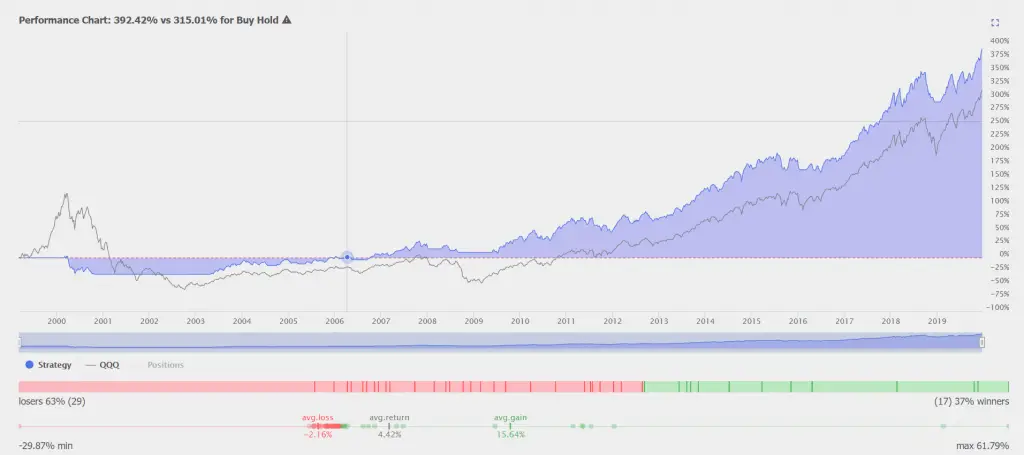
If you are interested in learning more about using moving averages in trend trading systems here are my additional resources:
Here are my three moving average books:
Here are my two moving average eCourses:
