In statistics, the standard deviation is a measurement of the magnitude of variation of a set of numbers that represent values. A smaller standard deviation shows that values are closer to the mean or average expectations of a set of data. A higher standard deviation shows that the values are more varied and over a larger range of possibilities extended from the average.
A standard deviation can also be represented in a formula with the Greek letter sigma ‘σ’ or simply with the Latin letter ‘s’.
In investing and trading if price points are extended far from the average of prices that means there is a higher standard deviation of asset prices and it is volatile and tends to move in a larger trading range.
A standard deviation is also a way to measure statistically the annual rate of return of a market or stock to see the historical volatility of that investment or trading vehicle.
A volatile market or speculative stock will tend to have a higher standard deviation of prices on average while most big cap stocks and stock market indexes will usually have a lower standard deviation and stay closer to historical prices most of the time.
Standard deviation is also used in risk management to measure the possible downside. It calculates all the volatility and uncertainty in both up and down prices as part of the risk in a market. Price movement is all measured as part of the risk of a standard deviation whether it’s in the investor’s or trader’s favor or not.
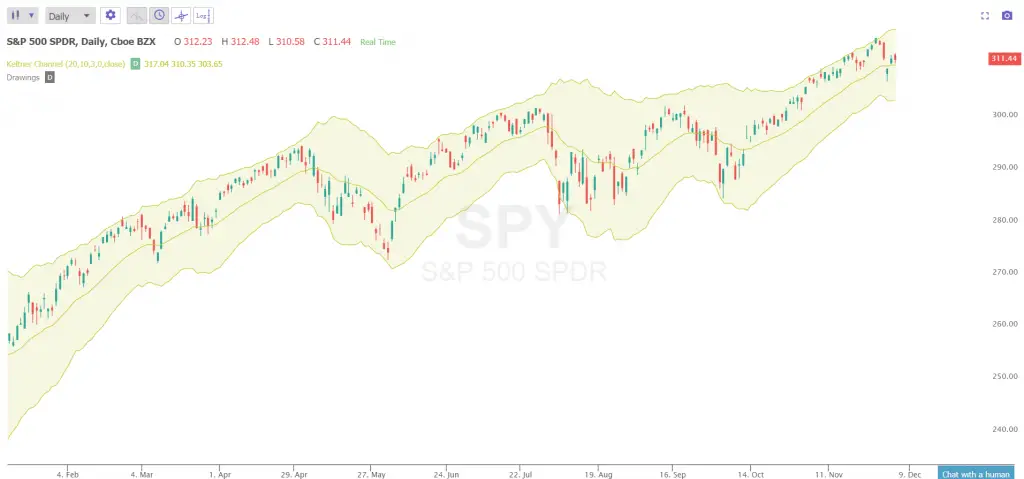
In trading and investing the standard deviation is used to measure the volatility of price action in the context of a price range and the distance from a key moving average. Some of the most popular technical indicators used to measure the standard deviation of prices is Bollinger Bands and Keltner Channels.
The wider the distance between the ‘bands’ of these indicators from the moving average the more volatile the market is said to be, The more that current price pushes against the outer bands of these indicators the stronger the trend in one direction has become. The longer that price action stays extended to multiple standard deviations from the moving average the greater the odds of an eventual return to the average becomes, this is called a reversion to the mean.
The more narrow that Bollinger Bands or Keltner Channels become and the closer they are to current prices the lower the volatility is on a chart. If price is very close to its short term moving averages then the market currently has low volatility and in a tight trading range.
Standard deviation expands during volatile markets and contracts during calm markets. Fear and uncertainty are generally the drivers of expanded volatility in markets price action.
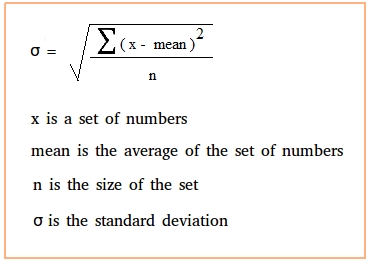
The formula for calculating a standard deviation is:


Keltner Channel Showing Three Standard Deviations from the 20 day exponential moving averageChart Courtesy of TrendSpider.com