Chart Facts about the Descending Triangle chart pattern:
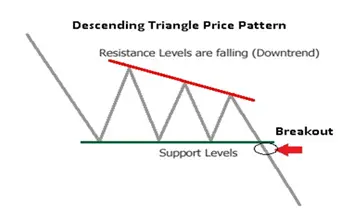
- The descending triangle is a bearish chart pattern that usually forms during a down trend as a continuation pattern.
- Sometimes a descending triangle pattern will form as a reversal pattern as an uptrend comes to an end, but they are usually continuation patterns in a down trend.
- Regardless of their location during a trend descending triangles are bearish patterns that indicate distribution. The descending upper trend line in the pattern is a clue that buyers are not accumulating positions at higher prices as the top of the pattern makes lower highs.
- The bottom horizontal support line on this pattern holds until the buyers have worked through and sellers at that price, the breakdown of the lower line of support signals a sell short signal for the potential of lower prices and the continuation or the beginning of a new leg in a down trend.
- Descending triangle patterns can be longer in time frame and wider in range than a bear flag or a bear pennant. The length of this pattern can range from a few weeks to months with the average lasting for 1-3 months. Many times the catalyst of bad earnings will trigger a breakdown for a stock or a news event could cause the breakdown for other markets.
- Many times volume will contract as the pattern gets near to a breakout as highs continue to trend lower. A breakdown with higher than average volume can give a higher rate of success for a short sell signal.
- Many times a rally and return to the breakdown price level will happen as old support becomes new resistance for a second chance short sell entry.
- Traditionally the price projection for this pattern after the breakdown is found by measuring the longest distance in the price range of the pattern.
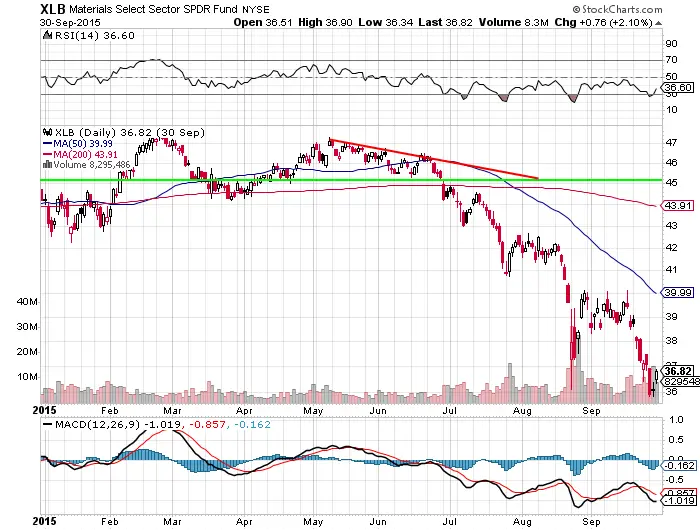
This $XLB chart shows a descending triangle pattern in May through June until breaking the support line to the downside. The red descending trend line shows lower highs while the horizontal green line shows support through the triangle. The breakout happened before the apex of the triangle was complete. A descending triangle can break down at any time and we just want to be identifying them by connecting multiple lower highs and multiple support levels in price. The triangle will likely not connect until after the breakdown. An apex breakdown does create a higher probability and clearer pattern.

Chart Summary: The descending triangle is a bearish chart pattern with support at the bottom at its horizontal trend line and resistance at the descending vertical upper trend line that is making lower highs. The pattern shows that buying power is declining as each rally is lower in magnitude but the market has support near a key price level. A breakdown of support is the bearish short sell signal. A stop loss could be set for if price returns and closes above the ascending triangle support line. The gain could be equal to the size of the largest area of the trading range inside the pattern. A price target could be for a run after the breakout equal to the largest point of the trading range of the triangle.
