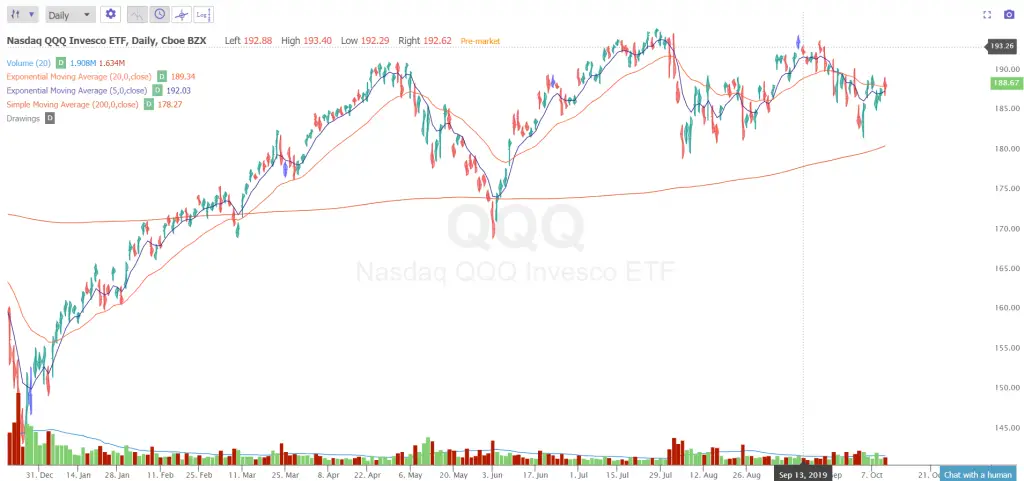
Moving averages are technical trading tools that can help identify trends on different time frames. They can replace opinions and predictions for making trading decisions by being used as signals. Moving averages can identify trends in real time but are not as useful during choppy or range bound markets.
Here are ten ways to use moving averages as price action trading signals:
A long term moving average like the 200 day can be used as a long term trend filter to show if the chart is currently in a long term uptrend or downtrend over the past 200 trading days. Price above indicates an uptrend, prices below indicate a long term downtrend. This can be used as a stand alone signal or as a filter to identify whether you should be looking to go long or short based on the path of least resistance.
“My metric for everything I look at is the 200-day moving average of closing prices. I’ve seen too many things go to zero, stocks and commodities. The whole trick in investing is: “How do I keep from losing everything?” If you use the 200-day moving average rule, then you get out. You play defense, and you get out.” – Paul Tudor Jones
In the short term the 10 day exponential moving average can be your guide to the short term momentum in the market. The 10 day EMA can act as support in upswings and resistance during down swings in the market.
“The 10 day exponential moving average (EMA) is my favorite indicator to determine the major trend. I call this “red light, green light” because it is imperative in trading to remain on the correct side of a moving average to give yourself the best probability of success. When you are trading above the 10 day, you have the green light, the market is in positive mode and you should be thinking buy. Conversely, trading below the average is a red light. The market is in a negative mode and you should be thinking sell.” – Marty Schwartz
A moving average crossover signal is created by using both a short term moving average and a long term moving average on the same chart. A crossover signal is generated when the moving averages cross above or below each other. A trader buys when the shorter term moving average crosses over the longer term moving average and sells when the shorter term moving average crosses back under the longer term one. For day traders this would be intra-day and for trend traders it would be an end of day signal on close. Instead of price crossing over or under a single moving average as a signal the shorter term moving average itself becomes the signal line as it crossovers over the longer moving average. A moving average crossover helps filter out a lot of the noise and false signals of a single moving average.
“Most of this trend following “science” can be explained by a decent moving average crossover. Don’t over-indulge in complexity.” – Jerry Parker
A moving average can be used as a stop loss on a trade to manage the risk at entry. When you enter you set your stop loss to the moving average that price should not go under if your trade is going to work out.
Position sizing can be used to manage your risk based on your moving average stop loss level.
You can use moving averages a trailing stops for winning trades. If price breaks and trends over the 200 day moving average you can trail your stop up with the trend to the 100 day, 50 day, 20 day, and 10 day moving average if it goes in your favor to both maximize your win and limit the give back of your open profits.
Unlike trend lines that can be discretionary in drawing and trading, moving averages are quantifiable facts based on math.
Moving averages are perfect for backtesting to see what signals worked in the past because they are grounded in math.
When a moving average is not respected as support or resistance after being broken that is sign of high volatility in the time frame.
Moving averages can act as ascending support in an uptrend and descending resistance in a downtrend.
Moving averages are both defensive tools for risk management and offensive tools for capturing profits.

Chart Courtesy of TrendSpider.com
You can learn more in my book Moving Averages 101 book.