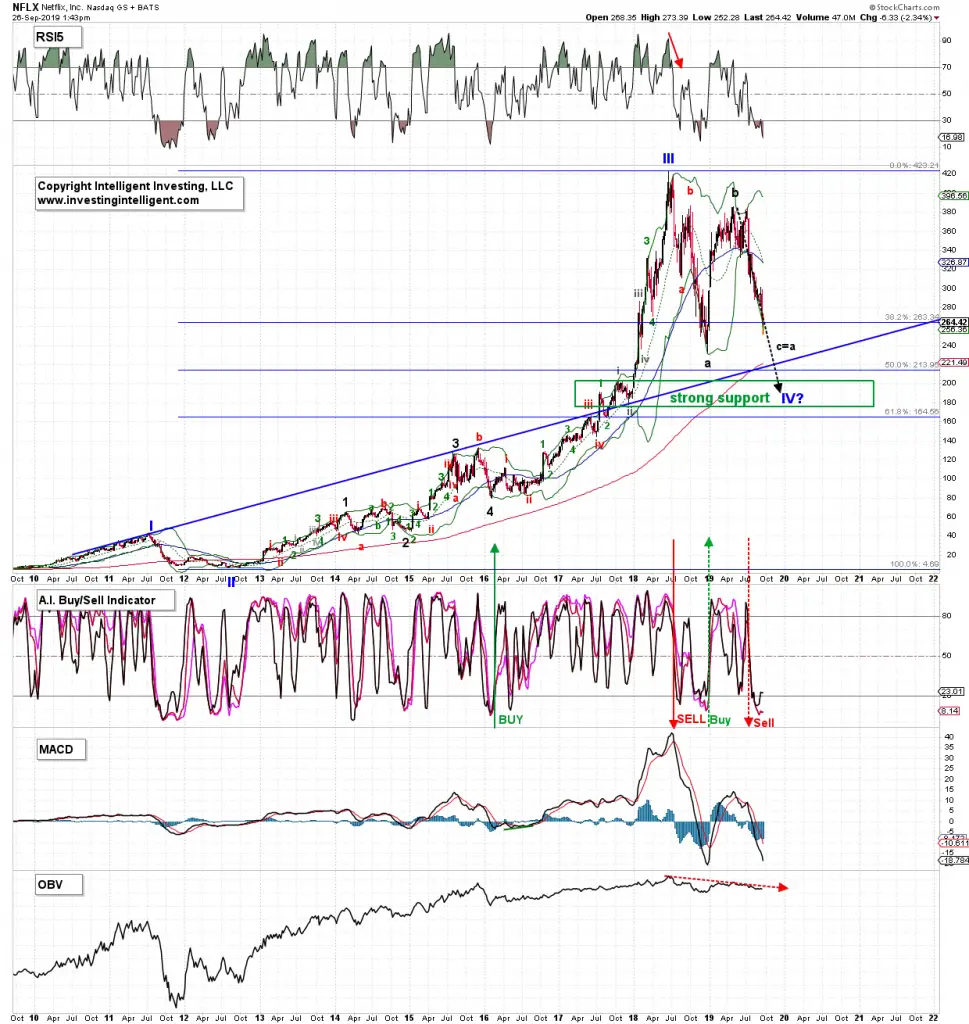
Netflix (NFLX) has been on a tear since 2012 but peaked in 2018 and has yet to best its All Time High. So, what gives? Currently it is trading almost 40% below peak levels and one should start to wonder if it is a buy or not because buy-low and sell-high is one of the best strategies on Wall Street.
Using Elliott wave analysis and combining it with “regular” technical analysis -which in my opinion is the most reliable way to assess charts- I find NFLX peaked for a (blue) Primary-III wave in 2018 and it is now ideally in a Primary-IV wave. Since corrections (2nd and 4th waves in Elliott wave terms) always move in at least three waves (labeled a, b, c in Elliott wave), this larger 4th wave has seen ideally wave-a completed at the late-2018 low, wave-b completed mid-2019 and now wave-c of IV is underway to ideally $190 where wave-c equals the length of wave-a. That region is also strong support and fits with the 50-62% retrace zone of the entire Primary III-wave.
Often 4th waves only retrace between 23.6-38.2% of the prior same-degree 3rd wave, but that is not necessary and as long as the 4th wave doesn’t overlap with the end of the 1st wave (in this case the 2011 high) then such a deep decline is fully acceptable. Standard patterns are just what they say they are “standard” and the markets are anything but standard. Especially since the 3rd wave (P-III) was very extended. Again, normally/standard a 3rd wave extends 1.382 to 1.618 times the length of the 1st wave. But, again, nothing is necessarily “normal and standard” in the real world and in this case Wave-III was almost 9.236x wave-I, so a deeper wave-IV is then to be expected as well.
If we then look at the technical indicators, we see that all (RSI5, MACD and my proprietary A.I. Buy/Sell indicator, which is based on price and momentum over different time frames) are all pointing down and all are on a sell: all three want to see lower prices. There is no positive divergence yet in place between these indicators and price and thus even a temporary bounce will most likely lead to lower prices. In addition, price is below its declining 20w and 50w Simple Moving Averages (SMA). This tells us the intermediate-term trend (weeks to months) is down. But price is still above its 200w SMA so the long-term trend (months to years) is still up. All of this adds weight to the evidence and fits with the preferred Elliott wave count and its associated price target.
Thus, for now, I continue to look lower for NFLX until it reaches $200 or so. A move and close back above $300 from current levels will have me re-assess my work but ultimately we will need to see price back above a rising 20w and 50w SMA as well to tell us all trends are back up.
Trade Safe!
Arnout Ter Schure PhD
Founder and President Intelligent Investing, LLC
Vice President NorthPost Partners, LP