This is a list of things to look for as possible signs before a stock makes a top and rolls over. Alone these are just possibilities but the probabilities increase as more of the signs are in place.
- When the RSI gets near 70 on the daily chart for a stock and it becomes overbought resistance, the price momentum to the upside slows, and the the price settles into a trading range.
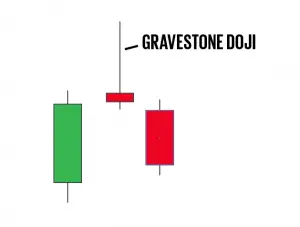
- A Gravestone Doji is a bearish candlestick that indicates a downside reversal could be about to take place. This candle shows a lack of buyers holding positions at higher prices and profit taking setting in. Price ends up near where it started after higher prices are rejected.
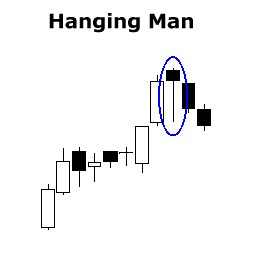
- If the market opens higher but fails to go over the opening price level for the entire trading day, this is a sign that buyers are rejecting higher prices. This is called a hammer or hanging man candlestick.
- The market opens below the previous days trading range and never gets over the previous days low, that is an early sign of a new trading range.
- The market starts to open higher but closes lower, that is a sign of distribution.
- The average daily trading range expands and volatility starts to grow.
- A huge volume day that gaps way up and then sells off into negative territory on high volume.
- A stock is far extended from all moving averages. The odds increase for a reversion to at least the 5 day or 10 day moving average.
- A major “good news” event happens but with little or no price movement higher, and the market is out of catalysts to drive it higher.
- When the majority of people think the stock will not pullback and they are against you short selling the stock.
These are just things to look for that could result in a short term top that lasts weeks or months and maybe nothing more than a pullback or a new range being traded. There are times to buy a breakout and times to wait for a pullback. There is a fine line between chasing the market higher and buying momentum.

