Trend lines are the identifiers and connectors of resistance and support in chart patterns.
Trend lines are ways to measure and quantify the path of least resistance for a chart in your time frame.
Trend lines are identifiers of the trend in your trading time frame.
Vertical trend lines must be drawn from left to right to identify one of the following:
A trend of higher highs signaling an uptrend.
A trend of higher lows for support in an uptrend.
A trend of lower lows signaling a downtrend.
A trend of lower highs for resistance in a downtrend.
Horizontal trend lines must be drawn straight from left to right to identify price levels of resistance based on repeating high prices that can’t be broken or levels of support based on repeating lows that hold.
Trend lines can connect end of day prices or the full daily range of prices. For candlestick charts the wicks represent intra-day prices that were outside the open or the close. Both are viable options for trend lines.
Trend lines should connect at least two price levels in a direct path to be considered viable. The more connections that a trend line makes the more meaningful it is.
Trend lines must be updated daily to ensure a trend is still in place. You want to see a connection and trend of prices in your timeframe.
A break out of price through your connecting trend line can indicate the beginning of a change in trend or market environment. A market could be going from an uptrend or downtrend to a sideways range as your trend line breaks or reversing in trend completely.
The vertical red lines on this chart represents the two downtrends that $XLE went through for weeks making lower highs day after day for much of the downtrend.
The green lines on the $XLE chart represent vertical support of higher lows as $XLE trends up twice on this chart. Notice that the red downtrend line was broken both times before the next uptrend began.
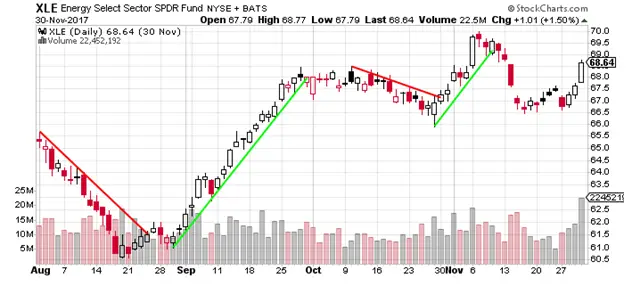
Chart courtesy of StockCharts.com
Chart Summary: Trend lines are visual ways to measure, identify, and track the trends on a chart by connecting vertical or horizontal support and resistance on a chart.
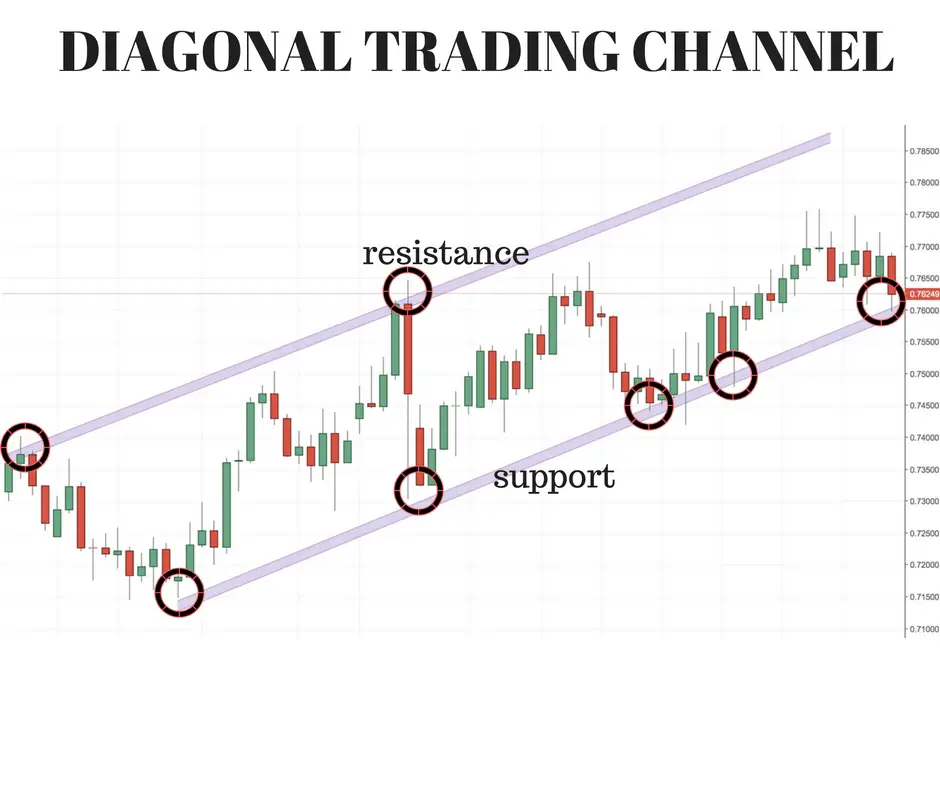
Price channels can be: up, down, or sideways.
There are uptrend, downtrend, and range bound price channels.
Here is an example of an up trending price channel:
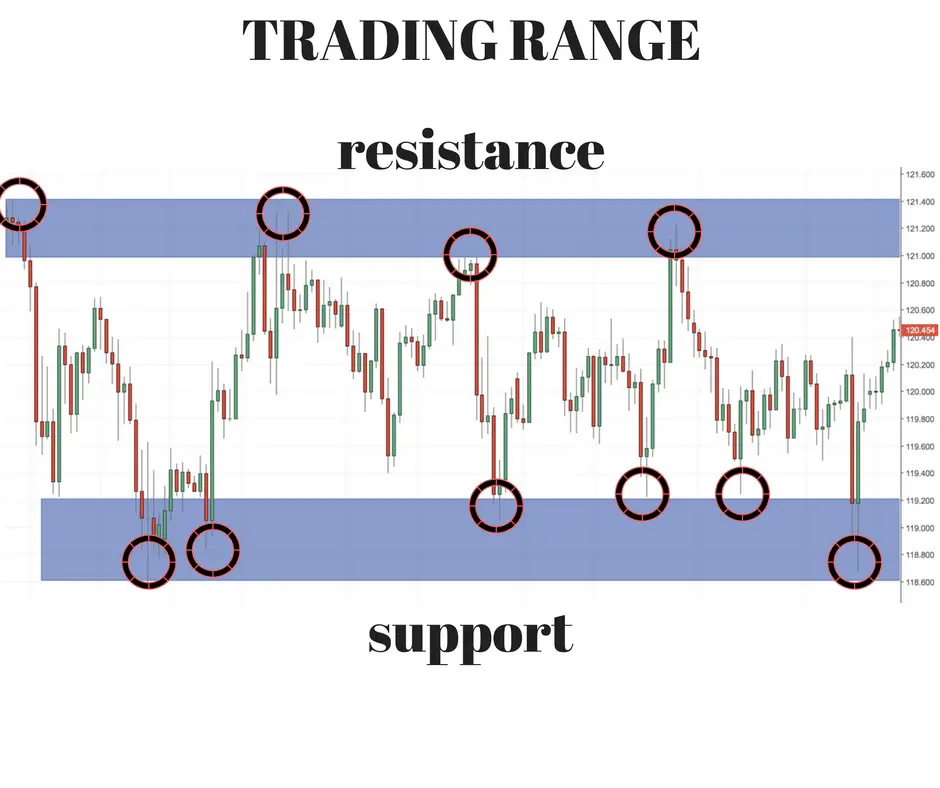
Here is what a range bound trading channel looks like:
Many times after a break out of resistance, old resistance can become new support: (Or vice versa).
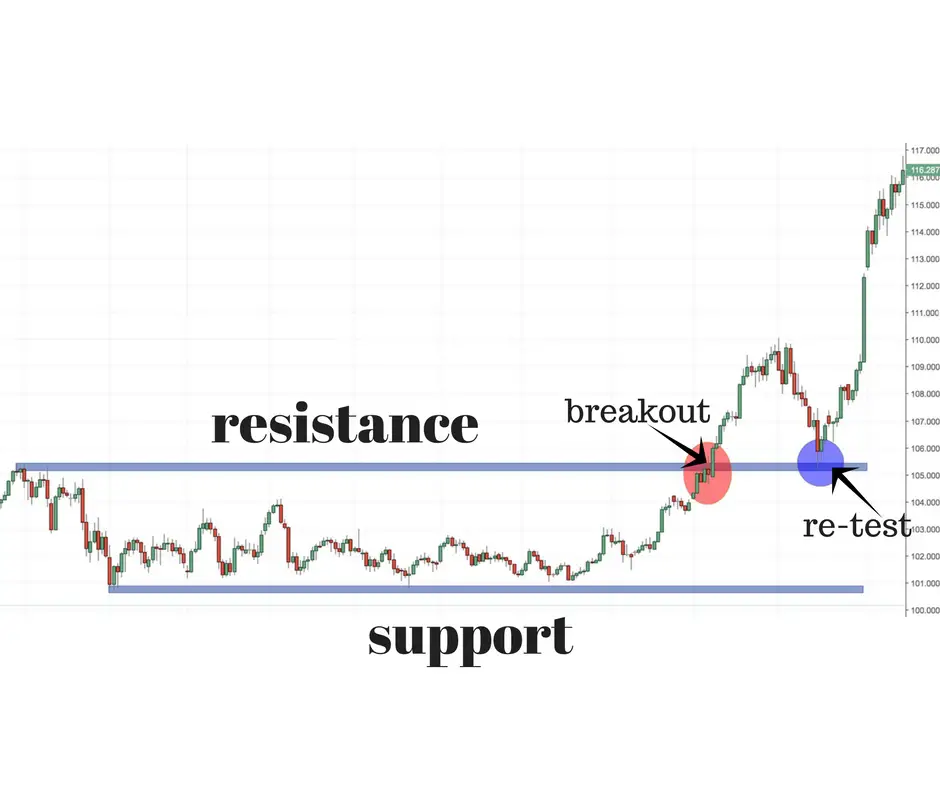
Chart Facts:
- A trading channel can be vertical or horizontal and is defined by trend lines.
- Vertical ascending up trend channels is defined by parallel higher highs and higher lows.
- Vertical down trend channels are defined by parallel lower highs and lower lows.
- Horizontal descending trend lines are defined by parallel lines that have price resistance around the same area of a high price level and price support around a similar lower area of price.
- Resistance lines in a chart pattern is where buyers are absent at higher prices and selling pressure at those prices set in.
- Support lines in a chart pattern are where buyers step in to buy at a price level to prevent prices from going lower overcoming the selling pressure.
- Buyers and sellers are always equal in any trade the variance is in what price that the trade will take place.
- Many times when a horizontal price channel is broken higher the old resistance becomes the new support.
- Many times when a horizontal price channel is broken lower the old support becomes the new resistance.
- Channels are for identifying where buyers and sellers are located.
- Momentum and trend signals are given when a well defined price channel is broken.
- Another name for a horizontal price chart pattern is a rectangle. The break out of the range in either direction is the signal to enter a trade in the direction of the break.
This $SMH chart shows examples of three ascending channels during the uptrend in this chart. The lower trend lines held up well in real time tracking and connecting on this chart. The upper trend line continued to set higher highs which was bullish. You also want to see the lower ascending support line continue to set higher lows by the close each day to keep reconnecting your lower trend line for ascending support.
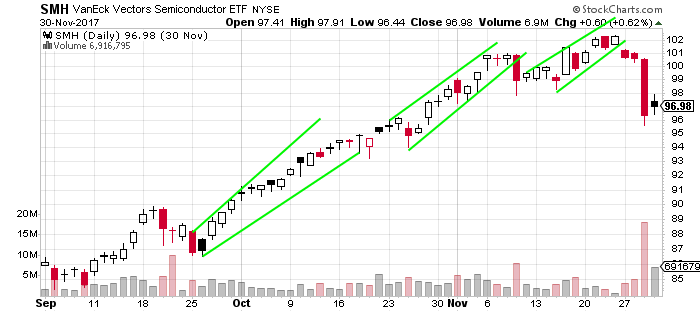
Chart Courtesy of StockCharts.com
This $PSX chart is an example of a reoccurring horizontal price channel for months. This is an example of a range bound market. The resistance is near $78.50 and support is near $74.50 to create a trading range. Notice that breakouts above and below these levels failed over and over. Returning to the previous price range after a failed break out is a sign of a range bound market. Trending market should have continuation after a break out is attempted several times. The best way to look for patterns of support and resistance is to look at where highs and lows of prices went to the last few times it made short term lows and highs in price.

Chart Courtesy of StockCharts.com
Chart Summary:
- In defined vertical price channels there are better odds of success in buying the direction of the channel.
- When trend lines connect higher highs and higher lows the best odds are on buying the dip in price to the lower trend line.
- When trend lines connect lower highs and lower lows the best odds are on selling rallies into the upper trend line.
- In horizontal price channels there are better odds of success in buying support and selling resistance.