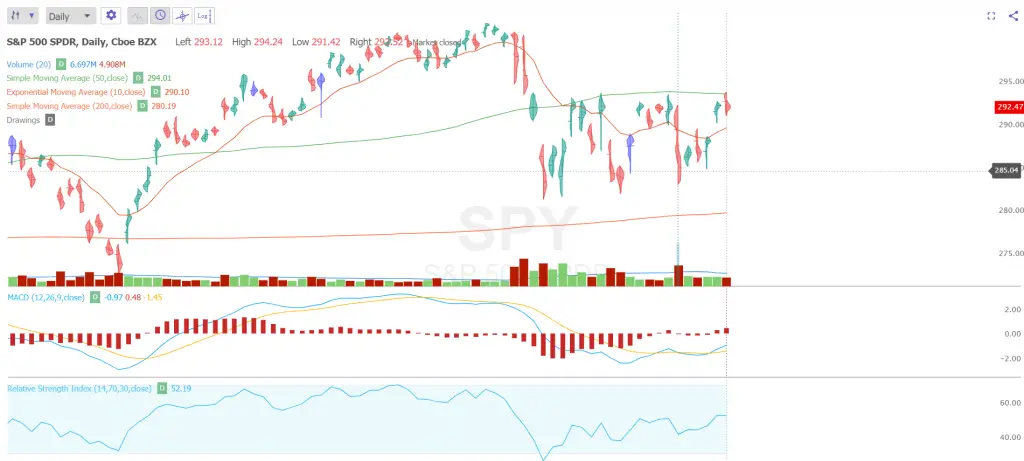
- The 50 day moving average is the current resistance on the $SPY chart.
- The $295 price level has also acted as strong resistance.
- Current support is the $282.50 price level.
- RSI is neutral but slightly bullish at 52.19.
- MACD currently has a bullish crossover.
- The Average True Range declined late last week to 4.19.
- The $VIX remains over the key 10 day / 30 day ema crossover at 18.98 and bounced off its 200 day moving average Friday. Fear and uncertainty still remain as we are in an expanding volatility environment.
- The market has been range bound from August 2nd to August 30th.
- The long term trend is still up and we are still within striking distance of all time highs,
- I am looking for a long signal after a 10 day / 50 day ema crossover showing momentum or a dip buy in the 30 RSI / 200 day moving average zone for a good risk/reward ratio.
You can get access to my review of the 20 charts on my watch list by subscribing to my video newsletter here.

Chart Courtesy of TrendSpider.com