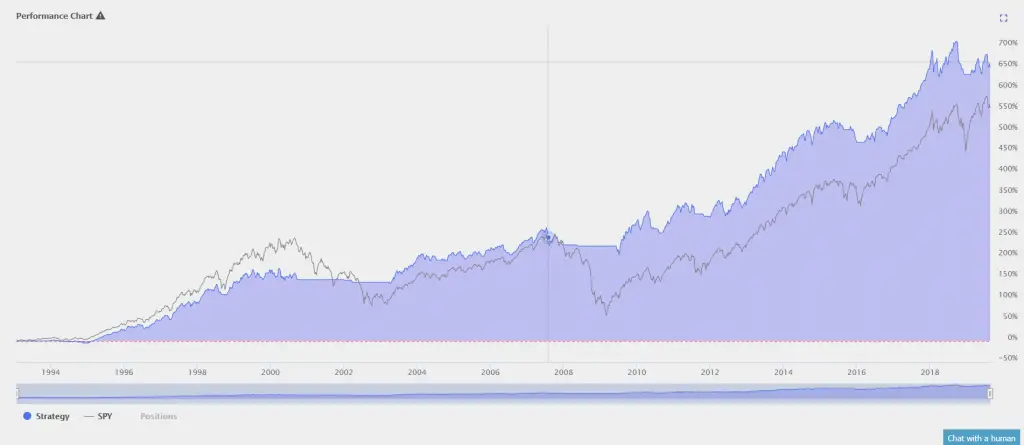
What is the best back tested trading strategies with moving averages? What is the best specific moving average signal for capturing stock market trends? After trading and backtesting data for years over the past 20 years of data I have an answer. I discovered one moving average crossover on the daily chart that backtested the best overall for most stocks, indexes, and sector ETFs. In writing my book ’50 Moving Average Signals That Beat Buy and Hold’ this pattern became clear with eight of the fifty backtests coming from this crossover signal as well as the 10 day / 50 day moving average crossover being featured in other books for specific signals.
This signal is based on buying at the end of the day when the 10 day moving average closes above the 50 day moving average and selling at the end of the day when the 10 day moving average closes back under the 50 day moving average. This repeating pattern is a good mixture of a key short term moving average smoothing out the gains from a longer term moving average and avoids most of the noise from price action cutting through one of the moving averages as a stand alone line creating a lot of false signals and volatility.
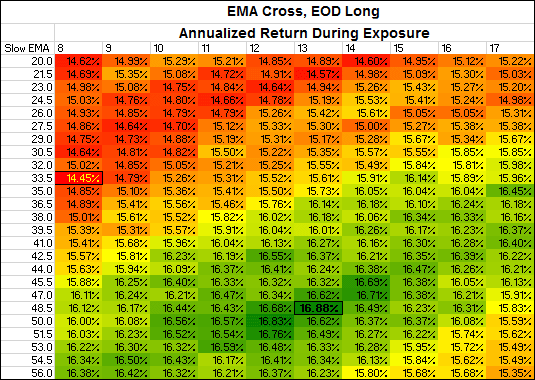
Interesting side note, after I determined the 10 day/ 50 day moving average as the best overall backtested moving average signal for the stock market. In searching online when looking to confirm my research I found this article: This Study Determined The Best Moving Average Crossover Trading Strategy-> Click Here What did they find was the absolute best moving average signal after their massive backtesting? Among short- and long-term EMAs, they discovered that trading the crossovers of the 13-day and 48.5-day averages produced the largest returns. Close enough. 🙂

Backtest Courtesy of TrendSpider.com.
