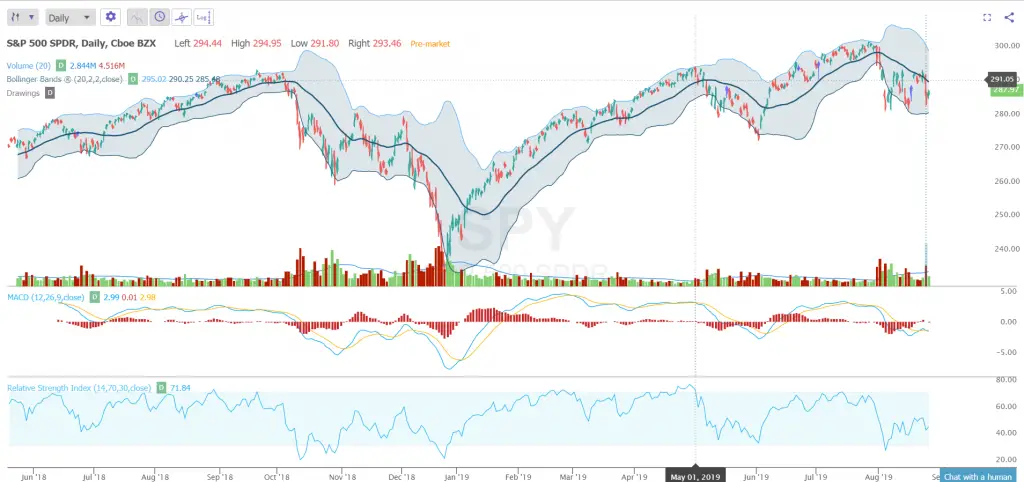
Bollinger Bands are a technical indicator created by John Bollinger in the 1980s. They were created to form a quantified visual trading range that was adaptive to dynamic volatility expansion and contraction.
“Bollinger Bands are use a measure of central tendency as a base such as a moving average. They curves drawn in and around the price structure usually consisting of a moving average (the middle band), an upper band, and a lower band that answer the question as to whether prices are high or low on a relative basis. Bollinger Bands work best when the middle band is chosen to reflect the intermediate-term trend, so that trend information is combined with relative price level data.” – John Bollinger
Bollinger Bands are a technical trading tool that is universal to all markets and trading time frames. This indicator was designed to show if prices are high or low on a relative basis for the chart. It shows if price is high at the upper band or if price is low at the lower band. This information is valuable for both ranges and can show when a trend is about to emerge outside the bands. Volatility is based on the standard deviation, which changes as volatility increases and decreases. The bands automatically widen when volatility increases and contract when volatility decreases. It is a great addition to a traders parameters and is useful inside the context of a confluence of other technical indicators.
Bollinger Bands consist of a middle band with two outer bands. The middle band is a simple moving average that is usually set at 20 periods. A simple moving average is used because the standard deviation formula also uses a simple moving average. The look-back period for the standard deviation is the same as for the simple moving average. The outer bands are usually set 2 standard deviations above and below the middle band.
A move in price to the upper band shows strength, while a price move to the lower band shows weakness. During range bound markets price action will stay within the bounds of the bands. During strong up trends price will ride up the upper band pressing it higher, during strong downtrends the price will push against the lower band and force it lower. A break outside one end of the bands can be a parabolic trend signal in the direction of the breakout. In sideways markets price will revert back from the upper or lower band to the middle 20 period moving average after reaching the top of bottom band. If price is over the 20 period moving average it is signaling an uptrend if price is below the 20 period moving average it is signaling a downtrend.
“According to Bollinger, the bands should contain 88-89% of price action, which makes a move outside the bands significant. Technically, prices are relatively high when above the upper band and relatively low when below the lower band. However, “relatively high” should not be regarded as bearish or as a sell signal. Likewise, “relatively low” should not be considered bullish or as a buy signal. Prices are high or low for a reason. As with other indicators, Bollinger Bands are not meant to be used as a stand-alone tool. Chartists should combine Bollinger Bands with basic trend analysis and other indicators for confirmation.” – StockCharts.com

Chart Courtesy of TrendSpider.com
Note: Bollinger Bands® is a registered trademark of John Bollinger. This post is for educational and informational purposes only.