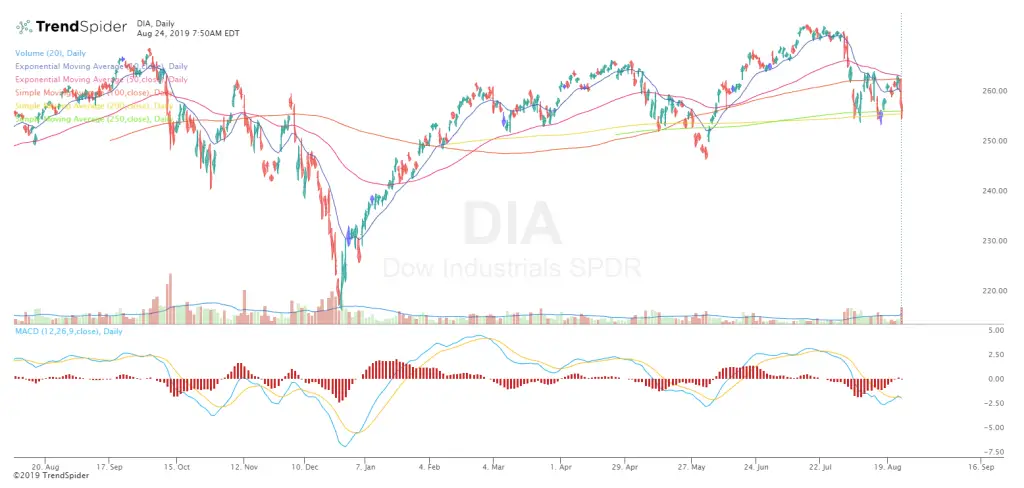
Moving averages are the best indicators for the direction of a trend because of their power and simplicity to smooth out price direction in trend trading. They create lines on your charts to filter out the daily trading ranges and show the true direction a market is going in for a specific time frame. When price is going up then moving averages go up as an ascending line. When price is going down then moving averages go down as a descending line. Moving averages can also show that a market is not going in any direction when a moving average is going sideways. Moving averages are great filters of the noise of intra-day price action and volatility as they are a single line on the chart for each time frame.
If price is above a key moving average it can be said to be in an uptrend in that time frame. If price is below a key moving average it can be said to be in a downtrend in that time frame. It can be surprising how many times an entire swing or trend can play out with one simple moving average to guide a winning trend trade. Moving averages weakness is high volatility or range bound markets that do not respect any moving averages as support or resistance. They are trend indicators and losses occur during choppy and directionless markets, the key is for winners to be bigger during trends than losing trades are during false signals. This happens through letting winners run with trailing stops and price targets and cutting losers short with stop losses early in the trade.
- Moving averages are a way to smooth price action and quantify a trend.
- Moving averages are tools that can work on any time frame.
- They can remove your predictions and opinions from your trading and replace them with moving average signals.
- Unlike trend lines, moving averages are quantifiable facts not left to interpretation.
- Moving averages are simple to use to backtest signals and strategies.
- You can combine multiple moving averages for crossover systems that are good at filtering out more noise and volatility and capturing trends with less false signals.
- Many legends mentioned moving averages in their trading like Ed Seykota, Jerry Parker, Linda Raschke, and Paul Tudor Jones.
- Moving averages are better ‘gurus’ to follow than the talking heads on financial television.
- No one can argue with quantifiable facts. Either price is above or below them.
- They have made me a lot of money during trends by using quantified signals to get me in when they begin and get me out at the end when the trend starts to bend.
Moving Average road map:
5 day EMA – Strong Momentum
10 day EMA – Short Term Trend
20 day EMA – Pullback Support
50 day SMA – Uptrend Defense Line
100 day SMA – Big Price Dip
200 day SMA – Bull’s Last Stand in an uptrend, bears last stand in a downtrend
250 day SMA – Value zone

Chart Courtesy of TrendSpider.com
Here are my three moving average books:
Moving Averages 101: Incredible Signals That Can Make you Money http://amzn.to/2tHHhNi
Here are my two moving average eCourses: