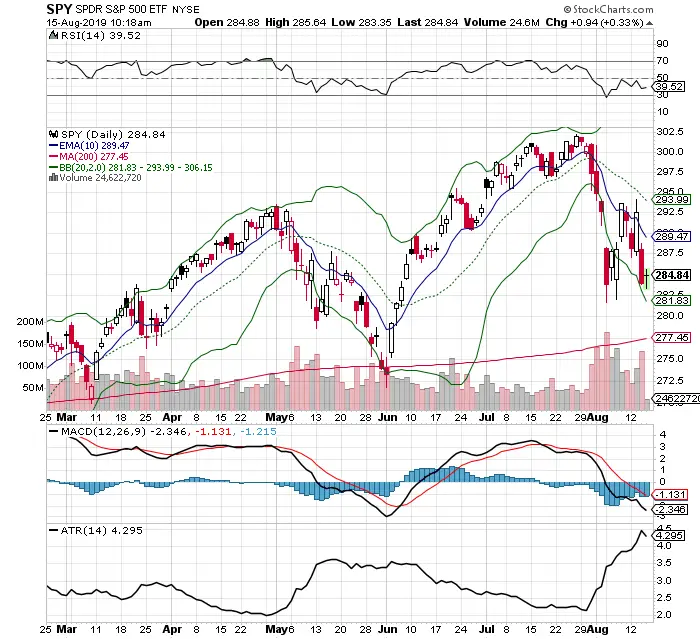
Technical analysis is a process for evaluating the historical price action on charts to identify the current trend or chart pattern to establish the possible probability of price action in the future. Technical analysts analyze past price action trading activity and the pattern of price changes in a market to project possible future price movements. Technical analysis is a different school of thought than fundamental analysis. While technical analysis focuses on historical price action, chart patterns, along with both up and downtrends, fundamental analysis focuses on a company’s financial results like earnings, book value, and cash flow. Fundamental analysis projects future trends in earnings and sales to project future prices adjusted for the new value of the underlying company a stock represents or the value of a commodity or currency.
There are many technical indicators that attempt to measure the rate of change of price action like the Relative Strength indicator (RSI). Other indicators try filter the volatility of price action to quantify trends like moving averages. Still others try to quantify a trading range like Bollinger Bands.
Technical indicators are not magical and they are not a Holy Grail. Market price action changes from trends to price ranges, and from low volatility to high volatility. They are good for building systems so you can measure your risk on each trade, and use them as trading tools to quantify your entries and exits. They are also helpful for identifying your risk and reward through technical price stop losses and projecting potential rewards based on technical levels.
Bollinger Bands are a technical trading tool that are best used in range-bound markets to measure support and resistance levels, when price gets extended from a medium term moving average like the 20 day SMA .
Relative Strength Index (RSI) is for finding good risk / reward ratios during overbought (70 RSI) or oversold (30 RSI) conditions. The RSI can work in both trends and range-bound markets, but it doesn’t work when a market price goes parabolic .
The Moving Average Convergence/Divergence (MACD) is a good tool for measuring swings in price up and down in markets with a wide price range.
Long term moving averages like the 200-day SMA are for trading long term trends.
Short term moving averages like the 5-day EMA and the 10-day EMA are for trading short term trends that have momentum.
Average True Range (ATR) measures the trend of volatility of the price range.
Technical analysis is used for identifying levels of price support and resistance or the direction of a current trend. Technical indicators are just trading tools; the profits come from how well we use them to build a price action trading system that fits our own risk tolerance and return goals. Technical analysis outside a quantified trading system is of little help in profitable trading as you still need a repeatable edge and proper position sizing.
