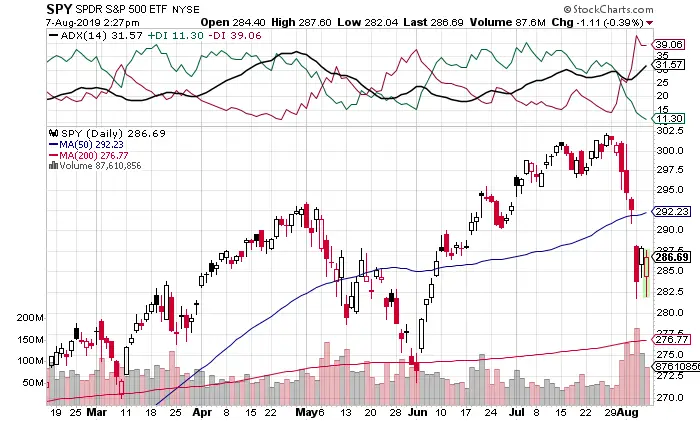
The Average Directional Index (ADX) is a technical indicator that uses the Minus Directional Indicator (-DI) and Plus Directional Indicator (+DI) to visually show a group of directional movement indicators that can be used as a trading system and was invented by Welles Wilder. Mr. Wilder created the ADX to focus on the daily prices of commodities this technical indicators can also be used in the stock market.
Positive and negative directional movement is the foundation of the Directional Movement System. Wilder used the ADX to determine the direction of the movement by measuring the difference between two consecutive lows with the difference between their respective highs.
The Plus Directional Indicator (+DI) and Minus Directional Indicator (-DI) are derived from smoothed averages of these differences and measure the direction of a trend over time. These two indicators are often collectively referred to as the Directional Movement Indicator (DMI).
The Average Directional Index (ADX) is derived from the smoothed averages of the difference between +DI and -DI; it measures how strong the trend is in either direction during the timeframe of the chart.
Using these three technical indicators together, swing and trend traders can use the ADX to see not only the direction, but also the strength of a trend.
The creator Welles Wilder introduced the Directional Movement indicators in his 1978 book, New Concepts in Technical Trading Systems. Wilder’s techncial indicators are very detailed and complex in their calculations and are still great trading tools to this day.
It takes around 150 periods of data to get true ADX values based on Wilder’s smoother techniques. The Average Directional Index (ADX) is used as a tool to measure the power or weakness of a trend as it plays out, not the direction of that trend. The direction of the movement is defined with the +DI and the-DI. The bulls usually have the advantage when the +DI is greater than the -DI, and the bears have the advantage when the -DI is greater. Crossovers of these directional indicator lines can be combined with the ADX for entry and exit signals for trades.
The Average Directional Index (ADX) can be used as a tool to signal if a market is in a trend or whether it is rangebound. This technical indicator and show traders whether they need to choose between trend following signals or swing trading signals on a chart. A strong trend is in place with the ADX over 25 and there is no current trend when the ADX is below 20. There is a neutral zone between 20 and 25. Traders can adjust the settings of the lines for faster or slower signals in their own timeframe. ADX has more lag time before signals of other indicators because of the smoothing techniques in its calculaitons. There are many technical analysts use 20 as a key level when they use the ADX on their charts.

Chart courtesy of StockCharts.com