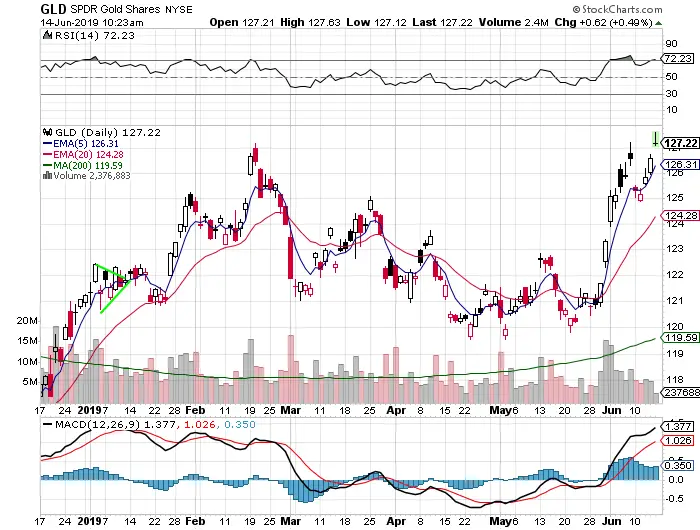
Moving averages are technical trading tools that can act as filtering lines for trends and support and resistance lines on charts. They can also be combined together for crossover signals to filter out more of the volaitlity of price action. Moving averages can also be used in confluence with other techncial indicators for discretionary trading or backtested on historical price action to create mechanical trading systems that remove the traders need to make decisions, predict, or have an opinion on the next move. They are not magic, they are just tools for creating good risk/reward ratios for trading trends with strategic entries and exits based on price action.
5 day EMA – Price support or resistance at this line shows strong price momentum in either direction.
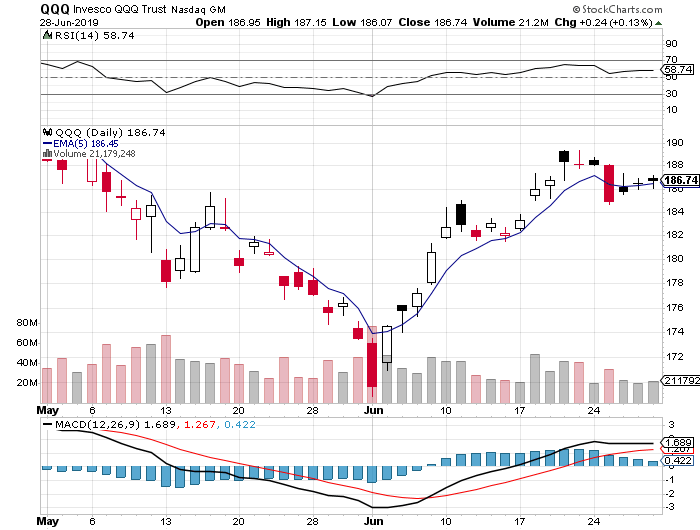
10 day EMA – Short term trend filter.
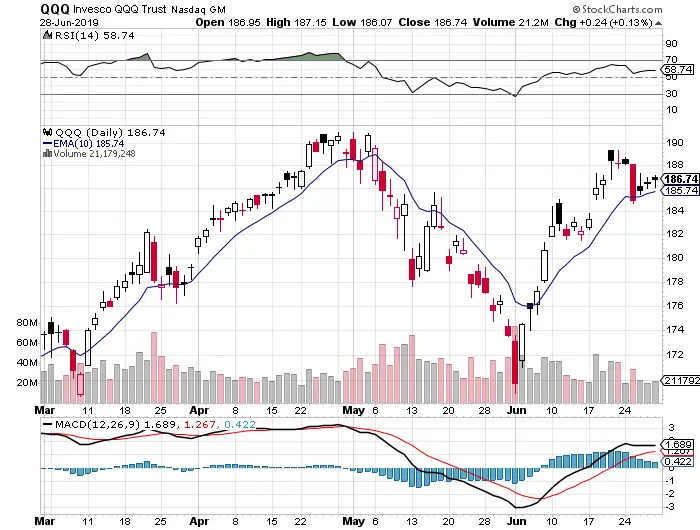
20 day EMA – Pullback support during uptrends and can also be combined with the 5 day ema for a crossover signal.
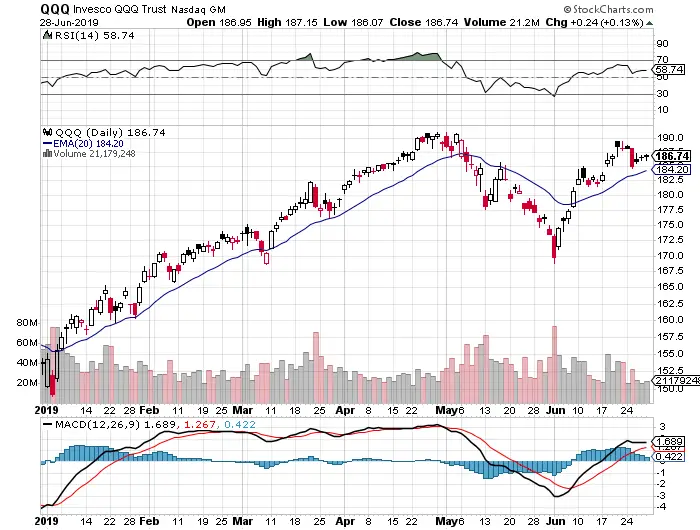
50 day SMA – Up trend defense line to see if the up trend will hold during a pullback.
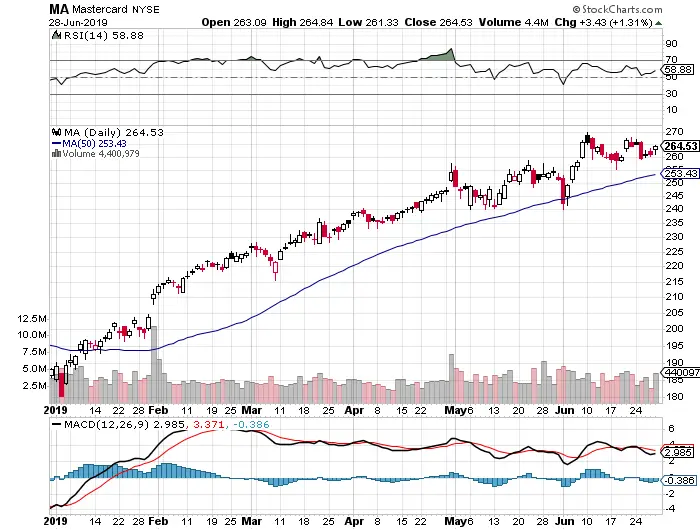
100 day SMA – This line can be a big price dip support during up trends or big resistance during strong downtrends.
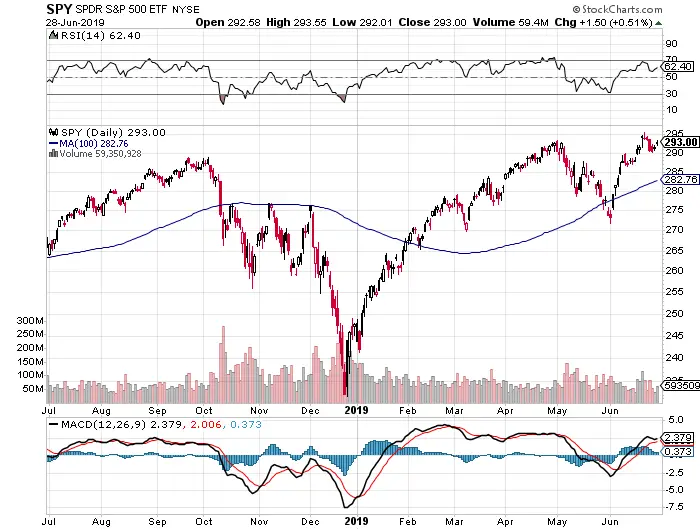
200 day SMA – Bull’s last stand in an uptrend, bears last stand in a downtrend
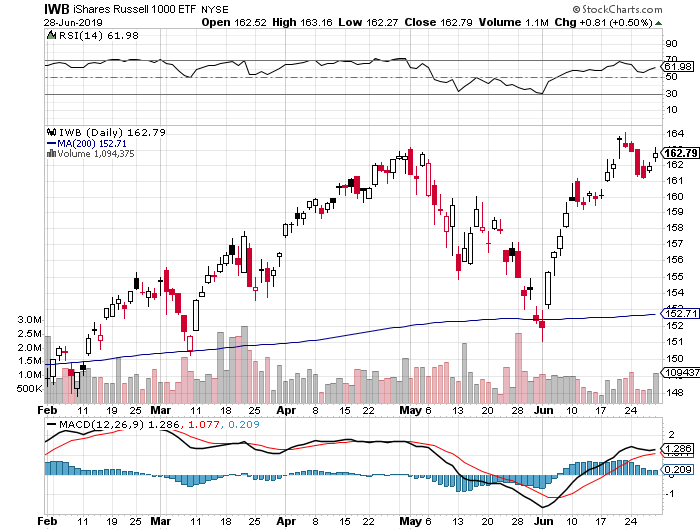
250 day SMA – Deep value zone buy when broken back over but resistance in a deep downtrend when rallies fail.
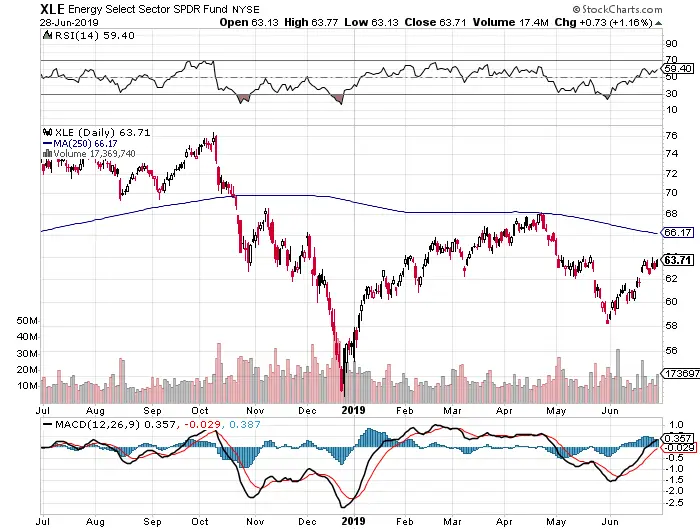
For more information check out my Moving Averages 101 book here or my Moving Averages 101, Backtesting 101, or Real Trade Example eCourses here.
All charts in this post are courtesy of StockCharts.com.
