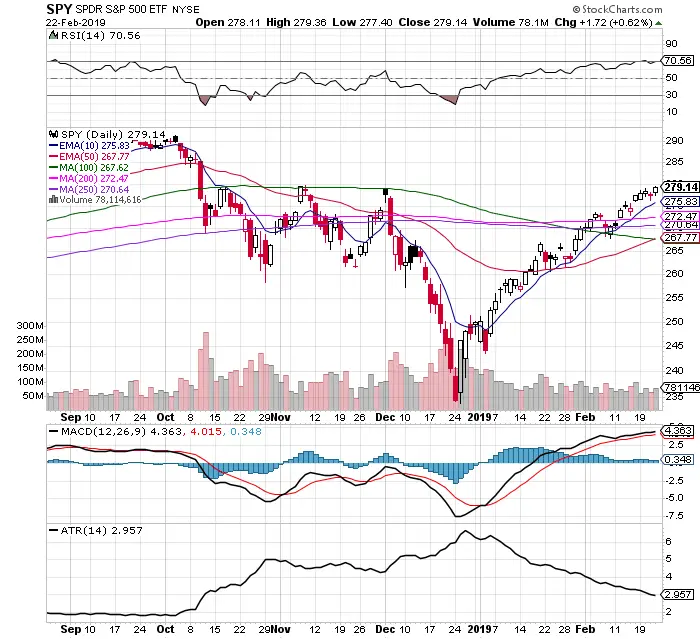
Chart Courtesy of StockCharts.com
- $SPY is near the last chart resistance at $279.50 from the two previous peaks that failed.
- Last week $SPY traded in a range from $276 support to $279.50 resistance.
- The $SPY stayed overbought at a 70.56 RSI.
- $SPY remains above all moving averages.
- $SPY remains of under several bullish crossover signals. 10/50, 10/100. and 10 day/200 day.
- The 10 day EMA has acted as end of day support since January 4th.
- The average trading range continues to decline and tighten to a 2.95 ATR.
- MACD continues higher under a bullish crossover.
- $SPY went higher 4 out of 5 days last week on good volume.
- The VIX at 13.51 continues to make lower lows and lower highs under the 200 day. Showing declining fear and uncertainty in the markets.
- The strongest sectors have been defensive Utilities $XLU and Real Estate $XLRE.
- The risk/reward ratio for long entries after this run up has shifted in waiting for a pullback. Going sideways with the 200 day acting as support would help work through overbought conditions and set up the next trend higher. Price closing under the 200 day SMA brings downside risk back as a possibility.