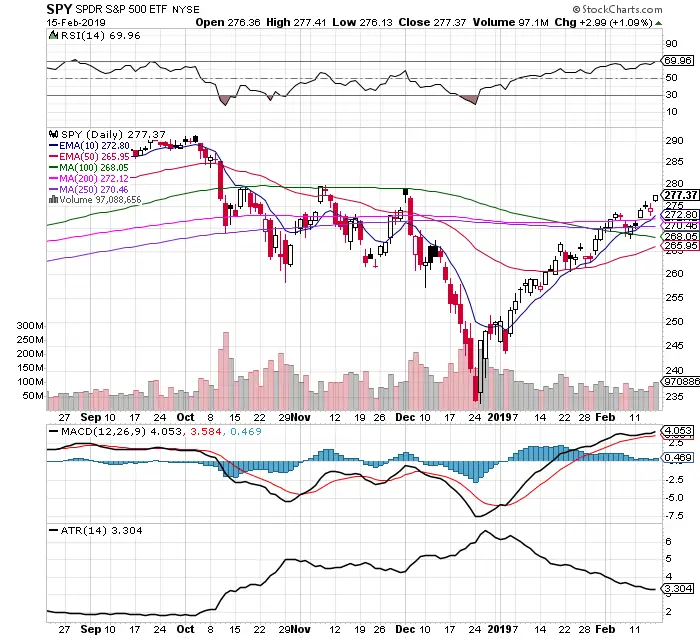
Chart Courtesy of StockCharts.com
- The RSI is at 69.96, a break and close above the 70 RSI that leads to a new uptrend is a rare event, this is usually the location of at least a short term pullback as the $SPY becomes overbought.
- The previous price resistance levels were around $280 on the last two false rallies that formed the double top. (The U.S. mid term election results and the false China trade deal news).
- The $SPY key current support level is the 200 day SMA.
- The current trailing support level on $SPY after the ‘V’ bottom has been the 10 day EMA since January 4th.
- $SPY currently is under several of the bullish moving average crossovers from my “5 Moving Averages that Beat Buy And Hold” book. These are long term bullish signals.
- The average trading range continues to decline to a 3.30 ATR showing declining volatility.
- The $VIX remains under the 200 day SMA and each rally back above has failed establishing the 200 day SMA as key resistance.
- The MACD remains under a bullish crossover.
- Last week’s rally was on healthy volume.
- With a diminished risk/reward ratio at these overbought levels after the speed of this move higher off the bottom the probabilities are that we pull back and or go sideways before the next move higher.