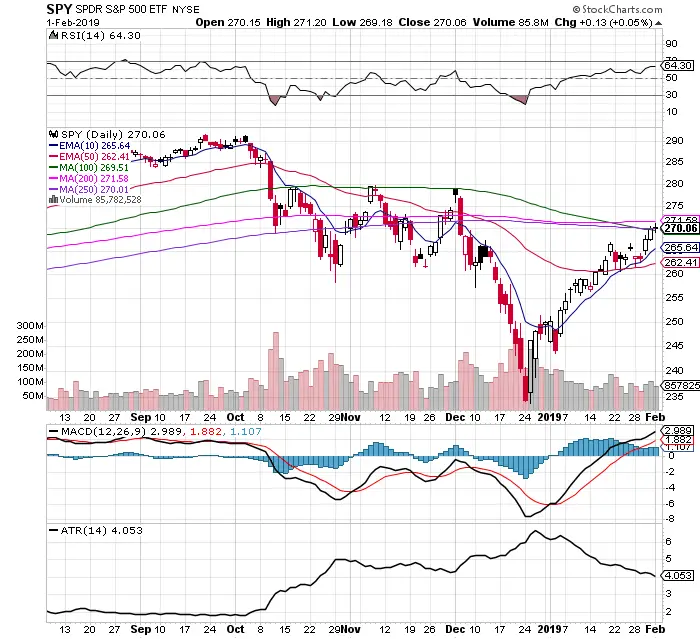
Chart courtesy of StockCharts.com
- $SPY broke over the 250 day SMA by .05 cents Friday. This is a bullish trend signal.
- $SPY had a bullish 10 day / 50 day EMA crossover on January 24th.
- The trading range continues to decline to a 4.05 ATR. A contracting price range is usually bullish as uncertainty and fear has declined.
- The $VIX closed under the 200 day SMA for the first time since October 5th which is bullish if it can trend lower beneath this key line.
- MACD remains under a bearish cross under.
- An RSI at 64.30 has room to go higher before becoming overbought.
- Volume last week was higher on up days than down days.
- The volume is healthy but below the 10 day average volume.
- There is still a lot of money on the sidelines from the high volume sell off from the 4th quarter of 2018.
- A break and close above the 200 day SMA would be the first step to a new bull market. A strong rejection there puts the odds of this move being just a swing higher inside a down trend back on the table.
We are at a crossroads between the 200 day $SPY breakout and the $VIX 200 day SMA support. A break of these levels and trend could be the guide to the next market direction.