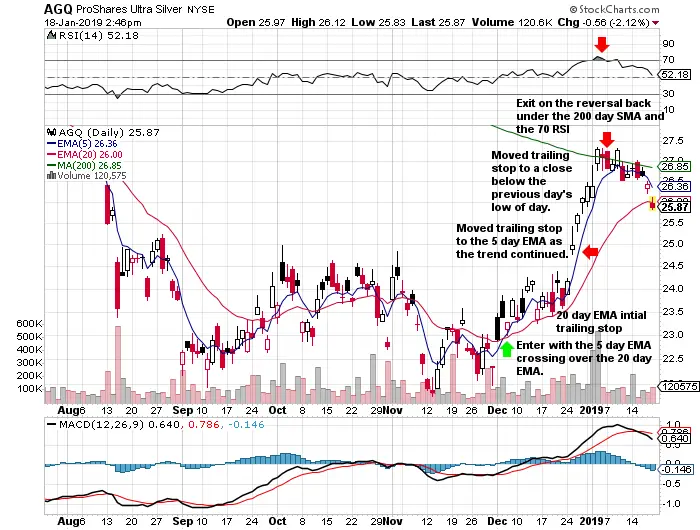
The below chart is an example of a recent trend trade I did using a 5 day EMA/ 20 day EMA crossover entry and a rising trailing stop to maximize profits.
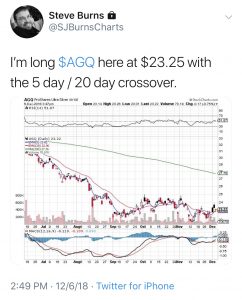
1. I entered $AGQ at $23.25 at the end of the day on 12/6/18 based on the 5-day / 20-day EMA crossover. My initial profit target was the 70 RSI and the 200-day SMA.
2. I set the 5-day ema/ 20-day EMA cross under as the initial stop loss signal on entry.
3. I set the close below the 20-day EMA as the initial trailing stop loss signal as it started to be profitable
4. When the trend got under way, I moved my trailing stop loss to the 5-day EMA.
5. As price accelerated even beyond the 5-day EMA I moved the trailing stop loss to a close under the previous day’s price low.
6. As $AGQ broke the 200-day SMA and the 70 RSI I moved my trailing stop to a close back under the 200-day SMA or the 70 RSI, I would lock in profits based on either of those closes.
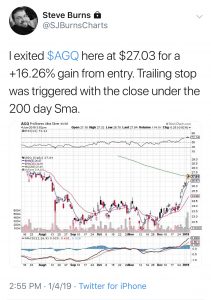
7. I exited $AGQ at $27.03 for a +16.26% gain on capital at risk as price looked like it was not going to close over the 200-day SMA on 1/4/2019.

Chart Courtesy of StockCharts.com
This was an example of a winning trade from my Technical Trading Newsletter.

