There was a question asked on finance Twitter by a wealth advisor that went something like this: “Okay, so you got out of the stock market and into cash in your 401K, and avoided the bear market, so when do you get back in?” Most portfolio managers believe in the long term, with asset diversification and quarterly rebalancing of your stock holdings and asset allocations. A lot of wealth managers don’t believe that market timing is possible, and that only investing in the stock market over the long term can workout through buy and hold investing for better or worse. Just wait for your investments to come back. Most wealth managers think trend following is impossible. Billionaire trend followers disagree.
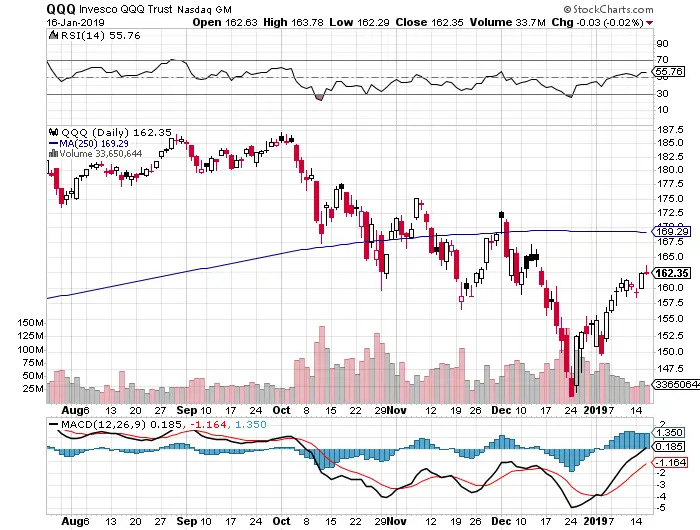
I will answer the question: “When should the average person get back into the stock market if they were able to go to cash and avoid the drop?” If you take something from the trend followers handbook, you should have already gotten out of your stock holdings when the $QQQ lost it’s 250 day simple moving average. What usually happens is that the investor holds his 401K as the 250 day SMA is lost, and then doesn’t get out until after the 20% correction happens or whenever maximum fear kicks in during the plunge. Wealth managers are concerned about investors having no quantified exit strategy, getting out too late after the correction or bear market has occurred, and then missing a rally waiting for another pullback that never happens. This kills investor performance, getting out too late and then also missing the next uptrend to the upside to compound the error.
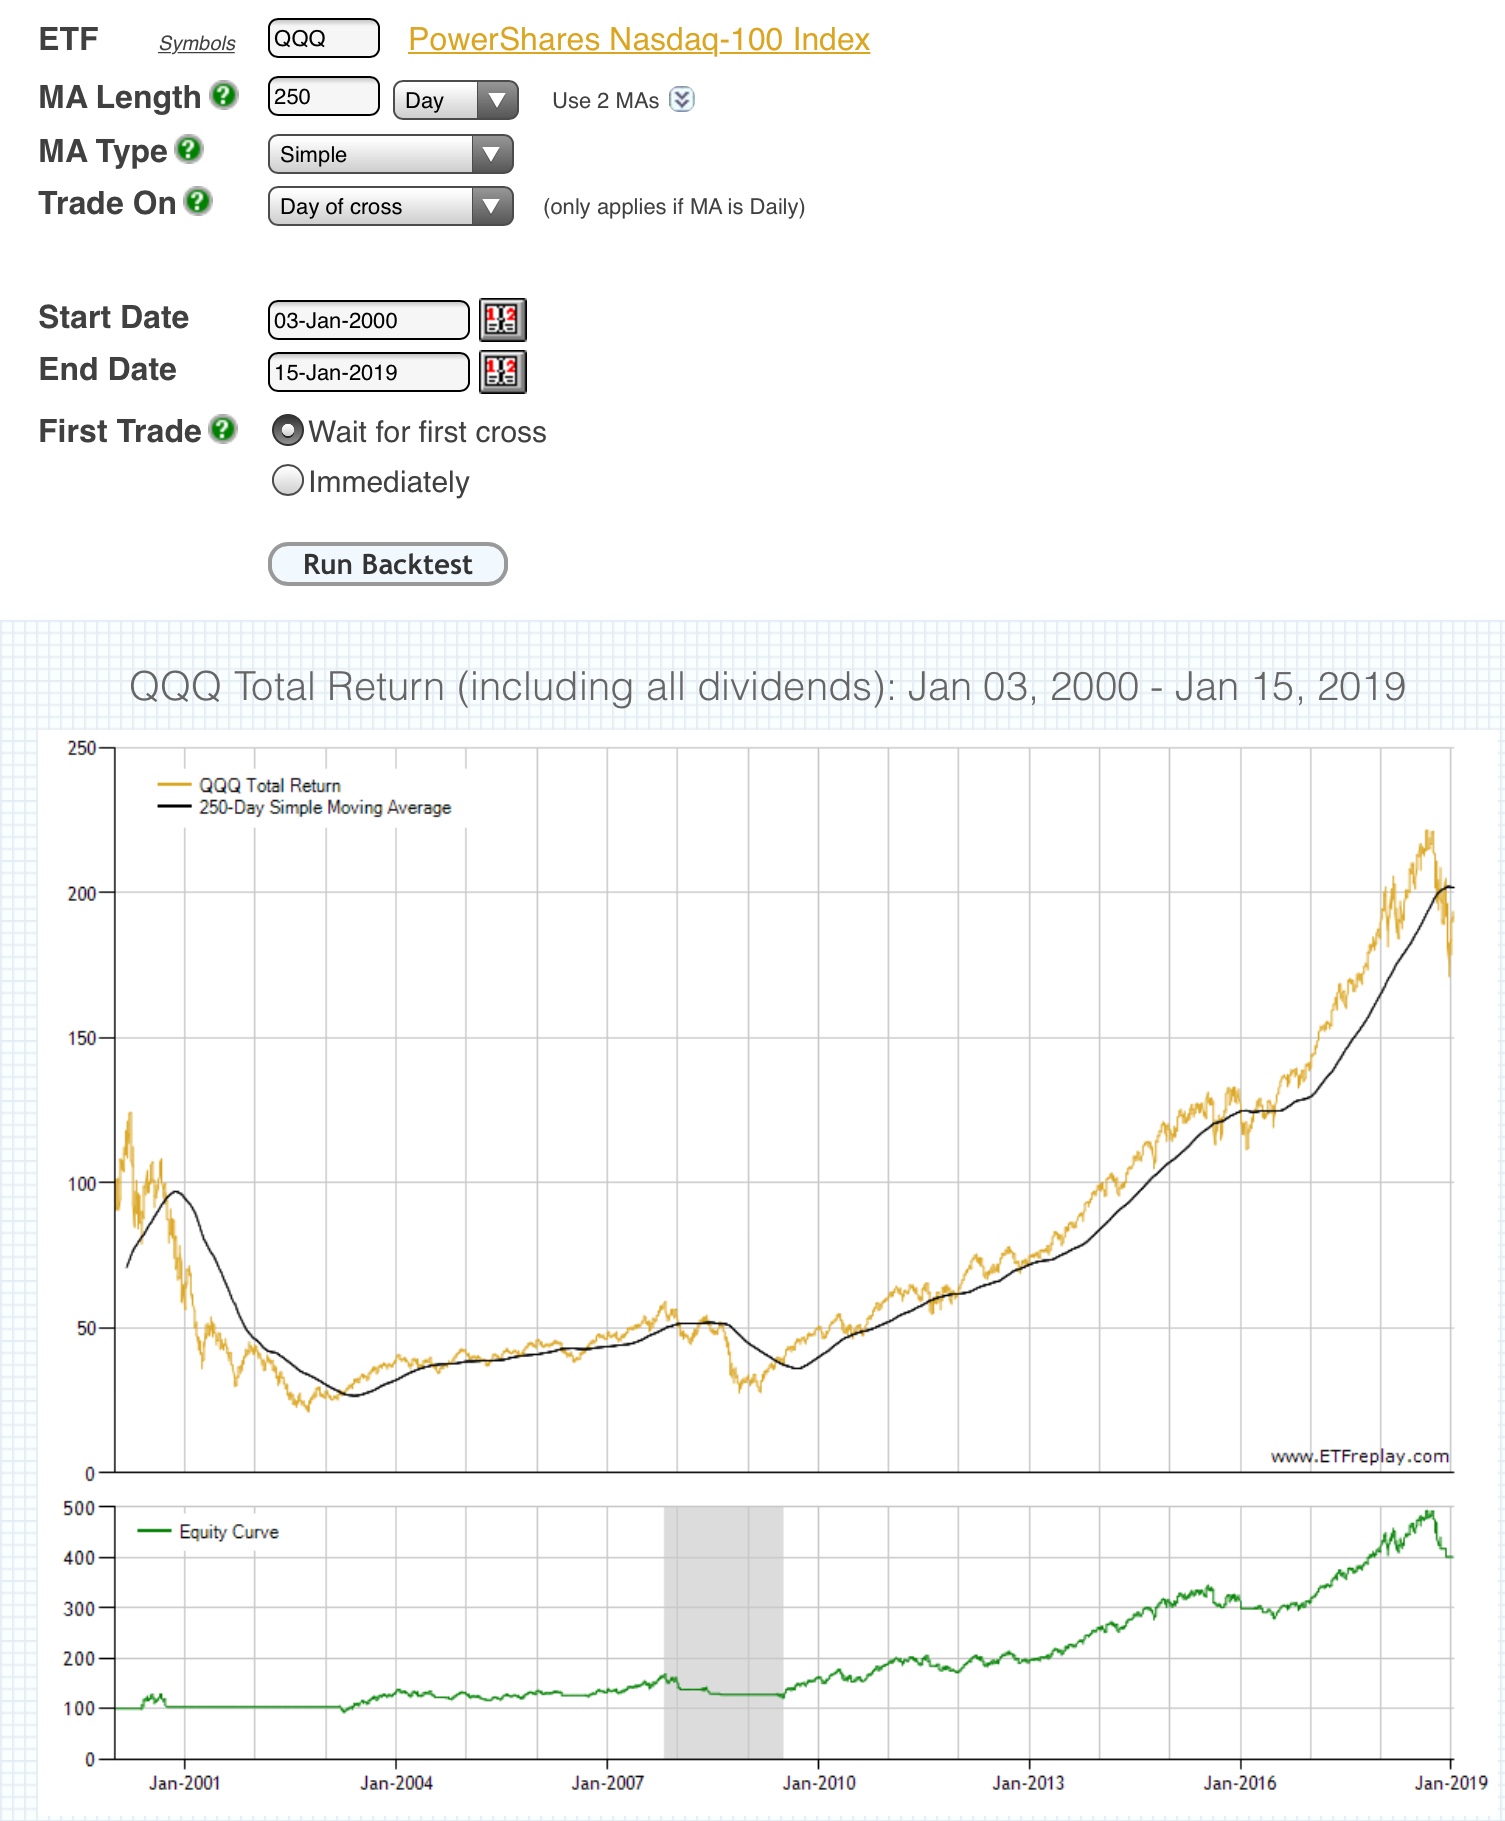
A systematic way to use quantified signals to get out of stock holdings before corrections, bear markets, and crashes is to go to cash when the $QQQ loses its 250 day simple moving average on the daily chart. When should you get back in? When the $QQQ price closes above the 250 day SMA. This gets you ready to participate in the next bull market when it starts.
This is not the Holy Grail of trend following for 401Ks, but it’s one way to avoid the financial and mental pain of watching 10%, 20%, or 50% of your retirement money evaporate in a market downturn. Watching your own 401K go from $200,000 to $160,000 is real and not theoretical. Your wealth manager or mutual fund manager still gets paid management fees as you lose money. I have successfully used this filter to keep my own retirement fund from having any major drawdowns during corrections and bear markets. It also was one signal that saved my retirement account in the 2008 meltdown and told me to start looking back at the long side in 2009 when it was retaken.
These are long only systems:
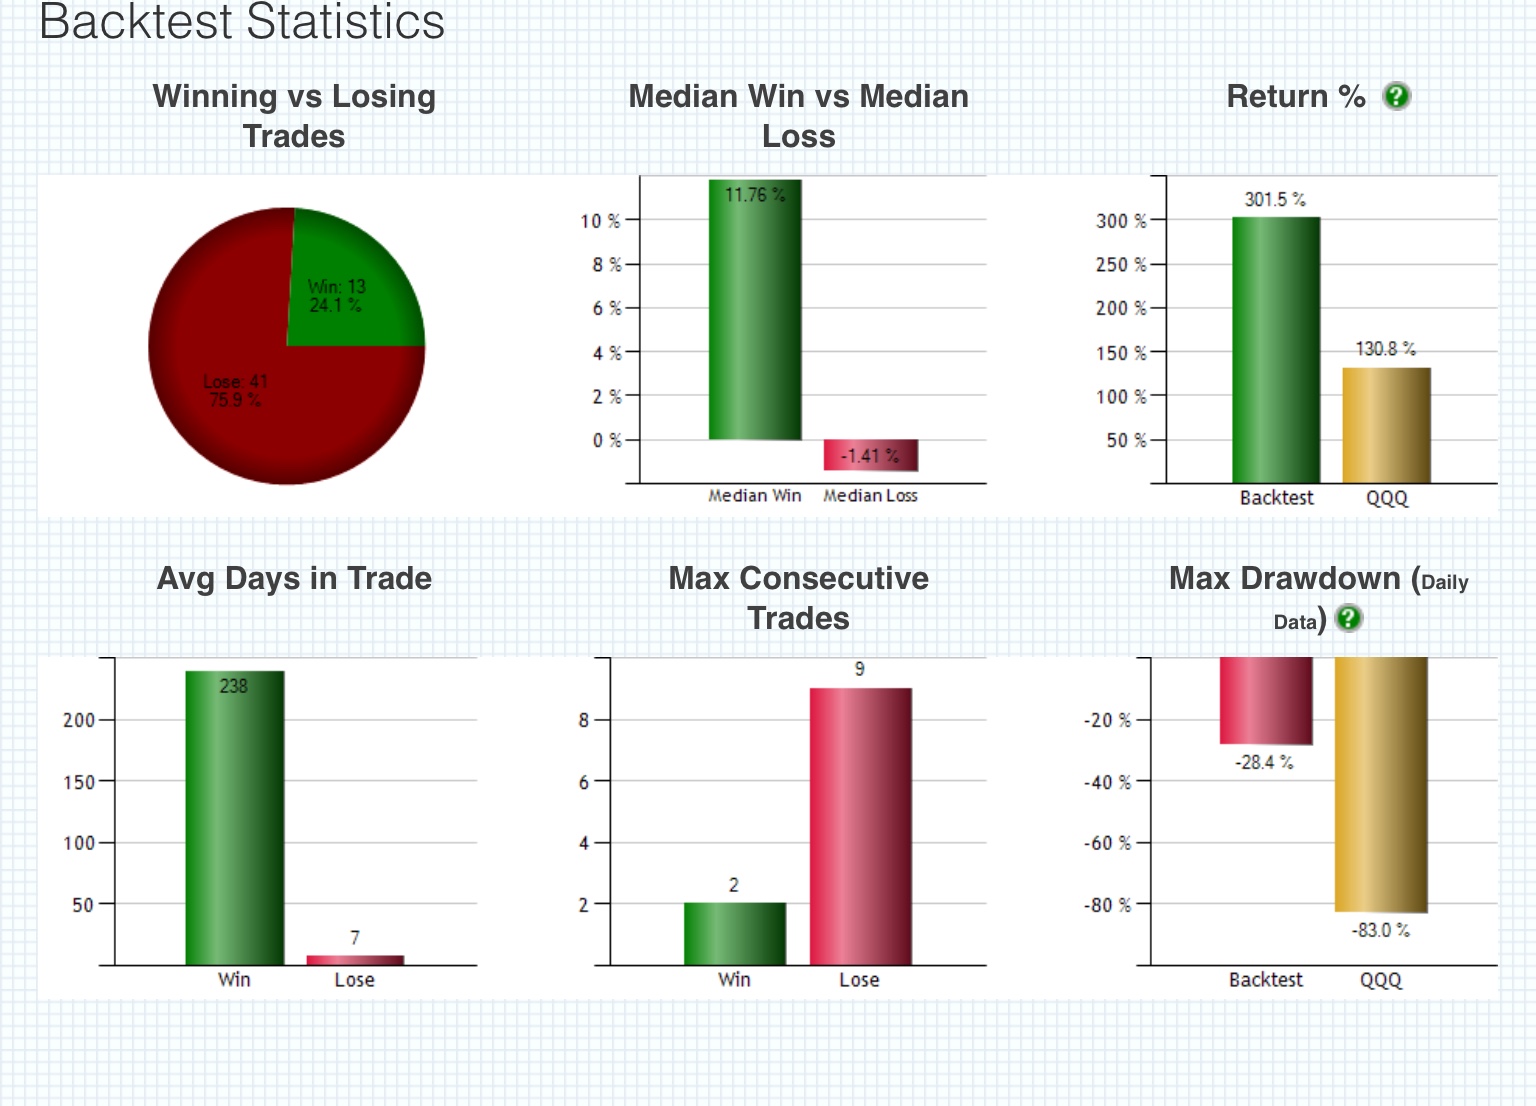
From January 2000 to January 16, 2019 $QQQ buy and hold returned +130.8% with an -83.0% drawdown.
For $QQQ using the 250 day SMA as an end of day sell/buy indicator from January 2000 to January 16 2019: 250 day SMA trend filter signal returns were +301.5% with a -28.4% drawdown. We cut the drawdown in half.
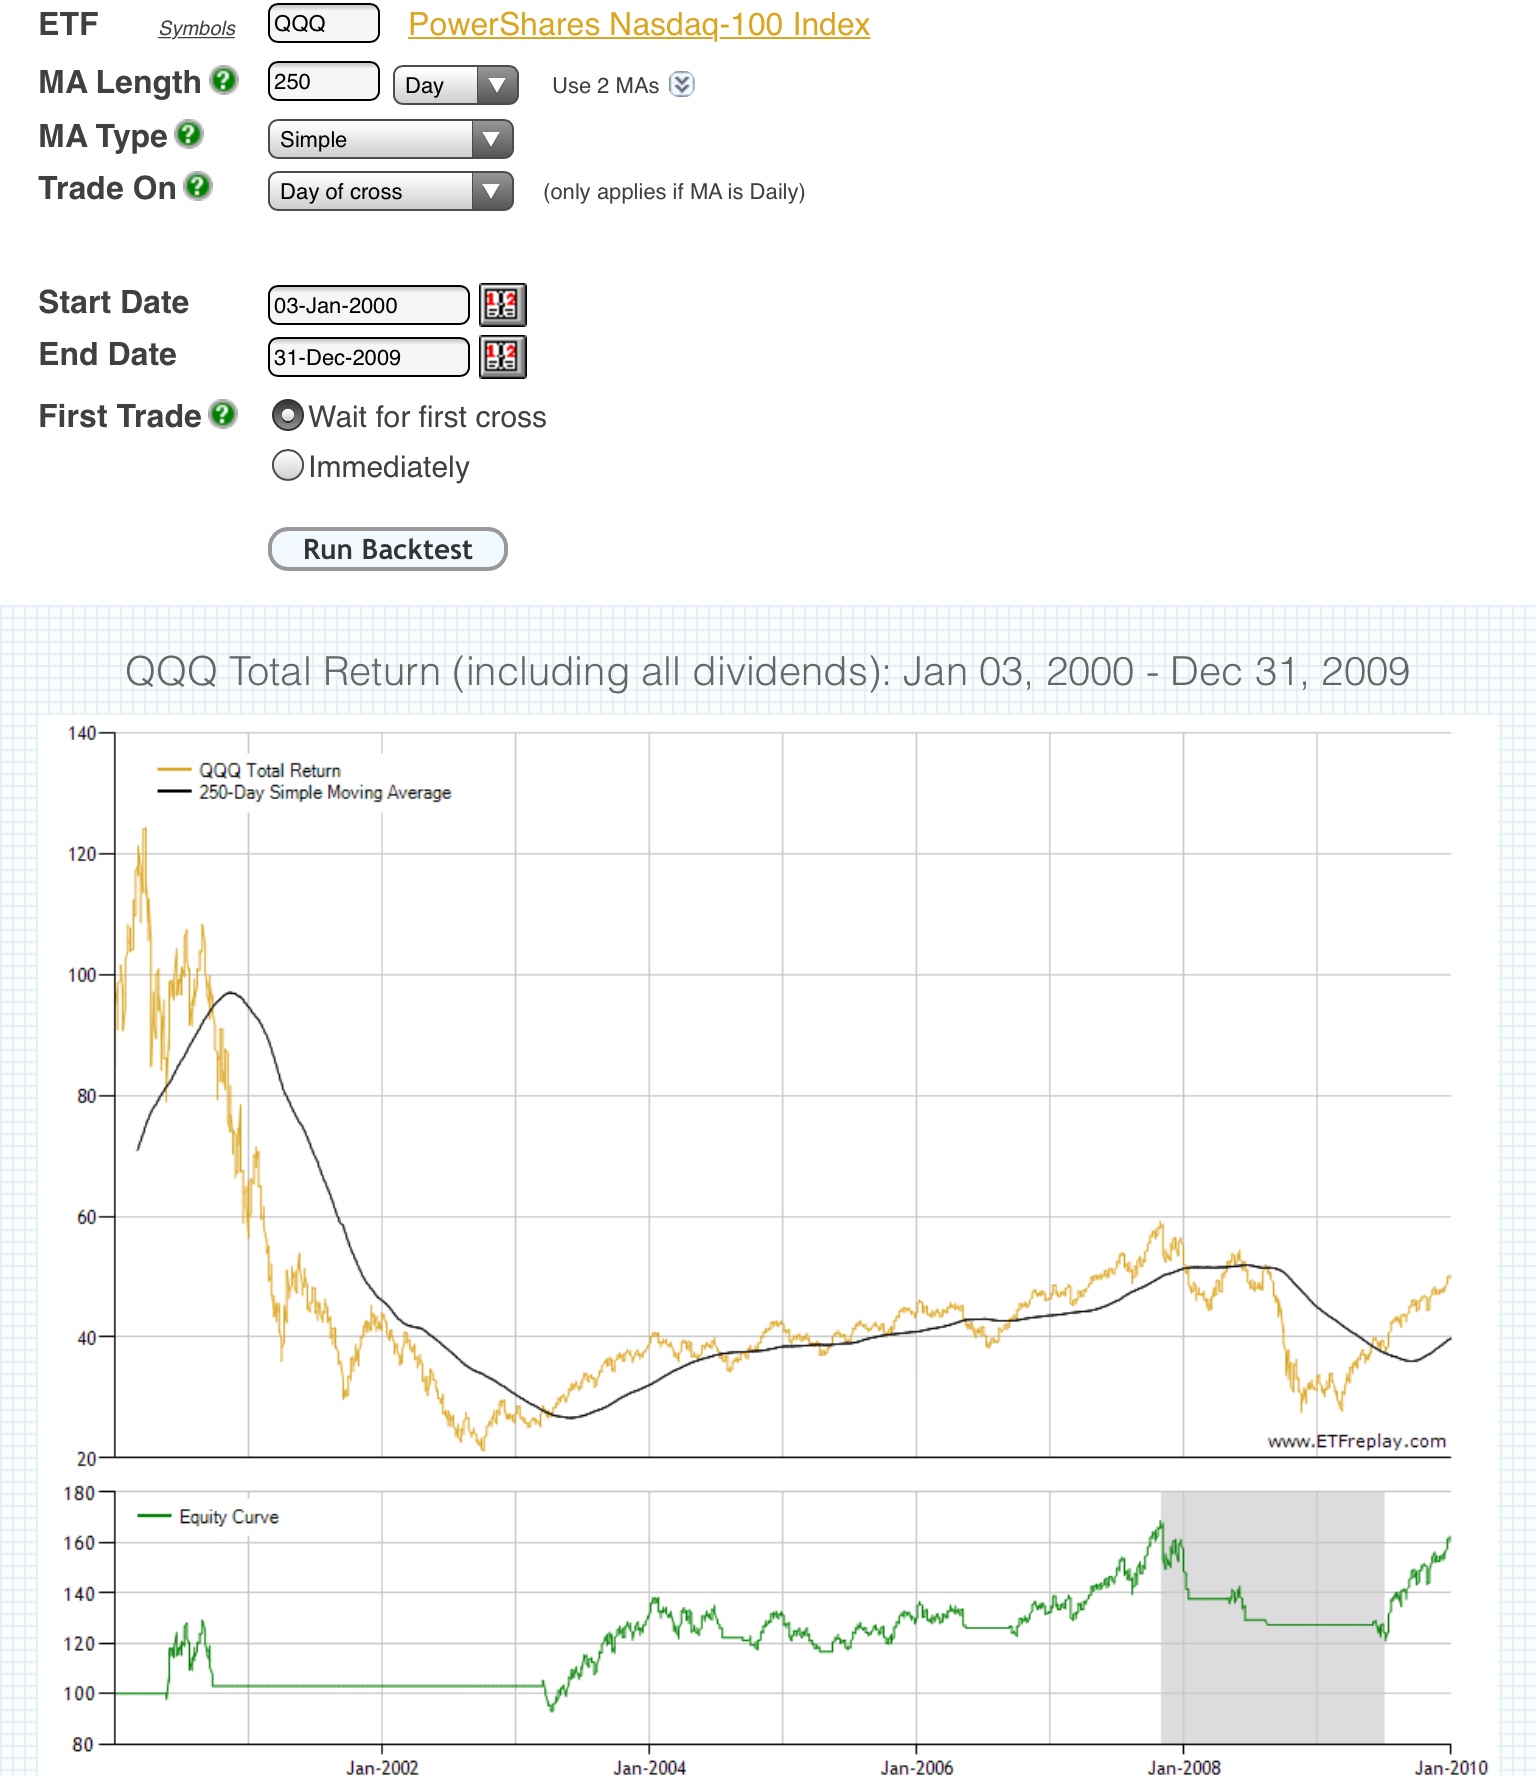
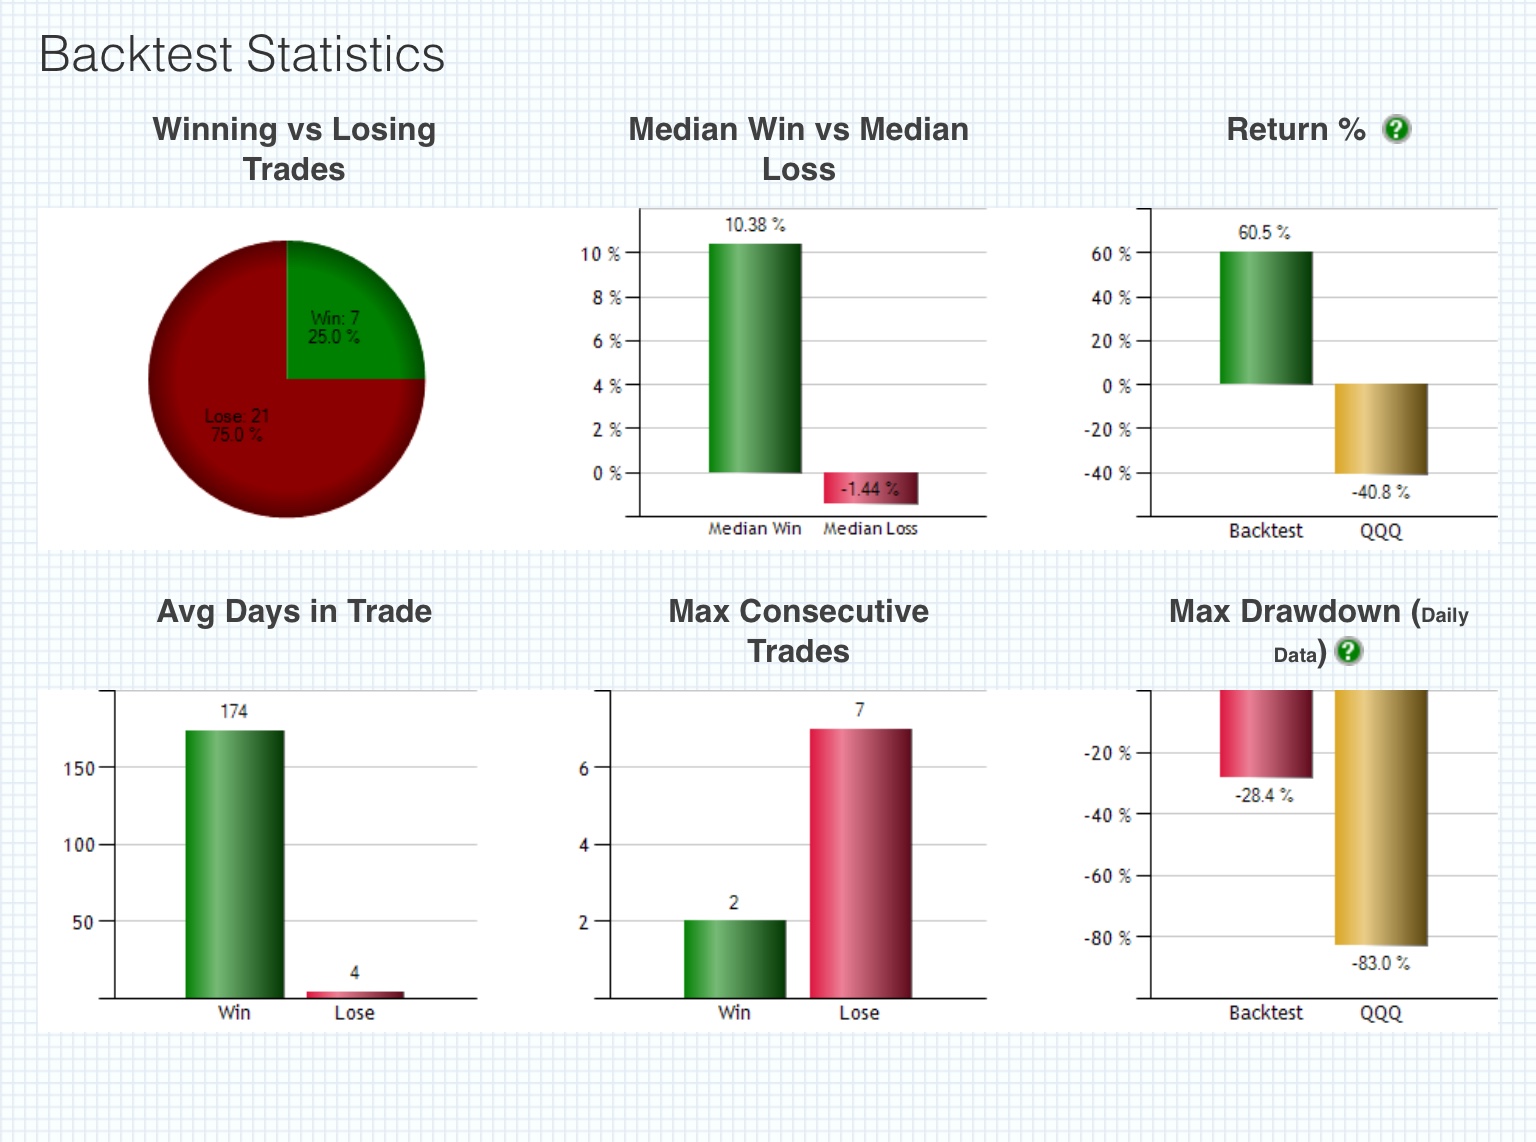
Here is how this signal backtested even during the lost decade of 2000-2009:
For $QQQ, using the 250 day SMA as an end of day sell/buy indicator from January 2000 to December 2009: 250 day SMA trend filter returns were +60.5% with a -28.4% drawdown. The $QQQ buy and hold returned a negative -40.5% return with a -83.0% drawdown for the decade. The 250 day cut the drawdown by 2/3rds and lead to a positive return.
There is a time to be long stocks and a time to out of stocks in 401Ks. The 4th quarter of 2018 was the time to be out, during the downtrend for most people. If the 250 day SMA is retaken in 2019 it will be a potential time to be long again based on this signal.
This is one example of a simple long term trend following signal for trading the $QQQ ETF based on backtesting results that outperform buy and hold on $QQQ. See more signals for beating buy and hold in my new book “50 Moving Averages That Beat Buy and Hold”
*Not investment advice just backtest information.