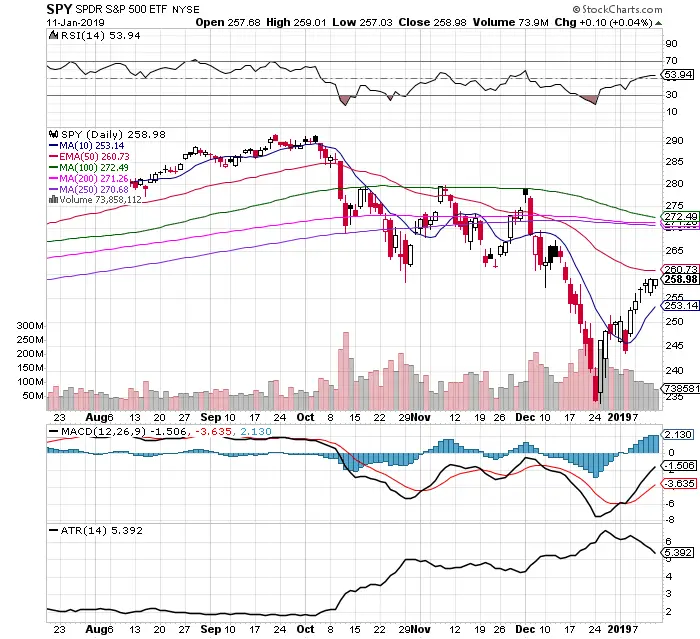
Chart Courtesy of StockCharts.com
- $SPY remains over short term moving averages last week like the 5 day and 10 day EMA.
- $SPY price remains under all key long term moving averages 50/100/200/250.
- $VIX continued to trend lower last week to 18.19 as volatility has been contracting since the day after Christmas.
- The trading range has declined as the ATR has continued to fall to 5.39. This is a bullish signal.
- The MACD continues to maintain a bullish crossover.
- $SPY continued to show momentum by staying over the 50 RSI side of the chart last week to end at 53.94.
- The uptrend swing higher since December 26th has been on low and declining volume.
- There remains a lot of cash on the sidelines after the volume to the downside from the Q4 2018 sell off.
- Short term trend is up, the long term trend remains down.
- My long signals for $SPY would be a 10 day / 50 day EMA crossover and/or the price crossing 250 day SMA crossover.