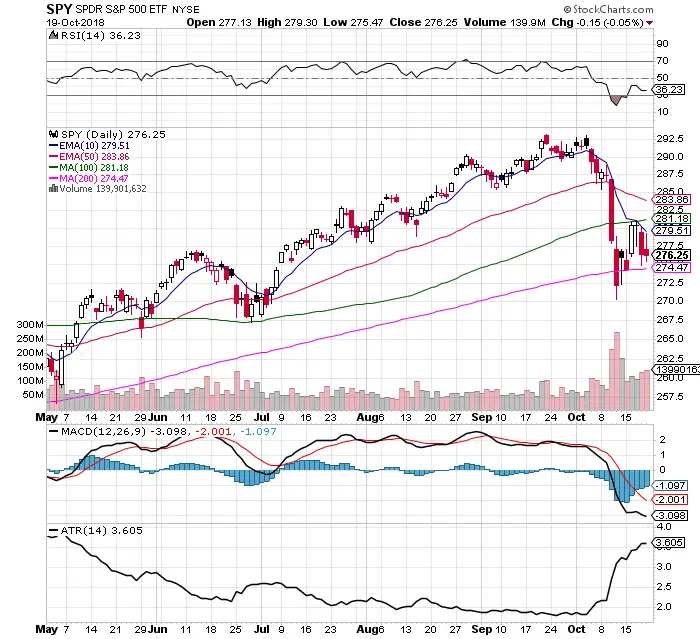
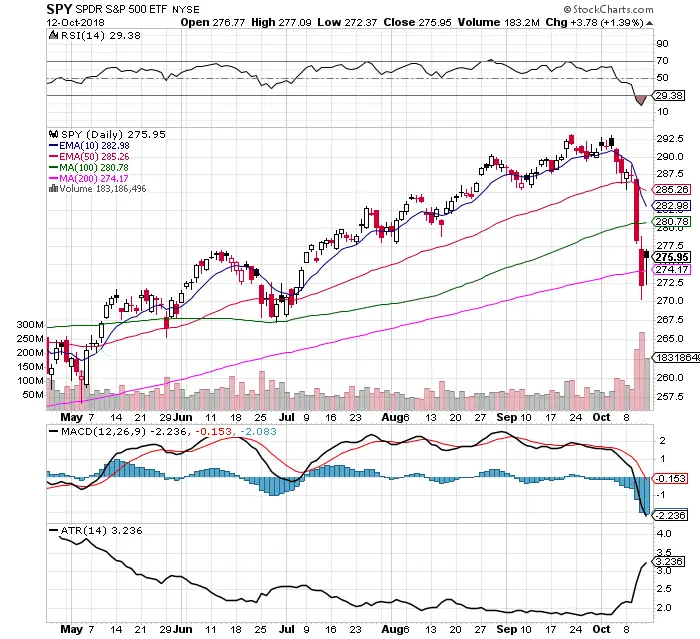
$SPY Holds the Line: 10/21/18
Chart Courtesy of StockCharts.com The $SPY chart that I use that is adjusted for dividends has closed above the 200 day SMA all but once in the past two weeks as the $SPX chart has lost the line multiple times. The chart that I use for backtests and trading has seen buyers show up at […]
$SPY Holds the Line: 10/21/18 Read More »


