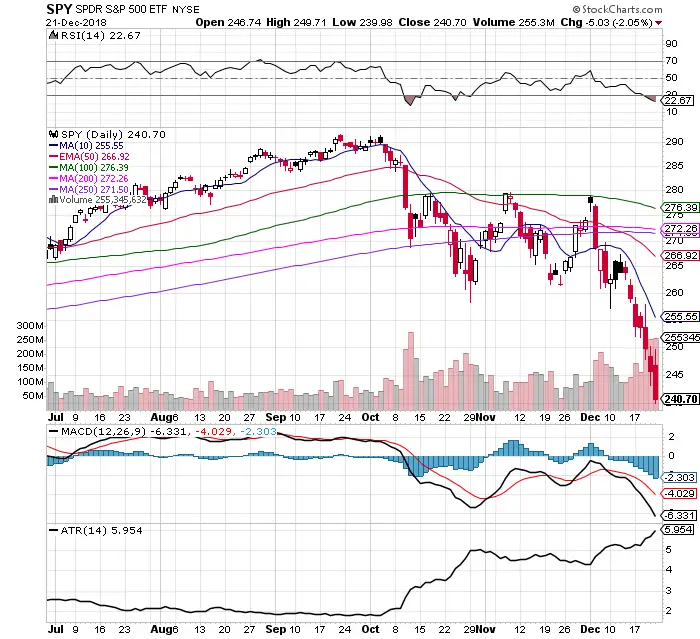
Chart Courtesy of StockCharts.com
- All my moving average signals are bearish and currently telling me to stay in cash until we have a confirmed reversal.
- The RSI at 22.67 is very historically oversold from a historic standpoint rarely does the S&P 500 go down and stay down so far and so fast with no bounce.
- The recent support low at $257.12 on December 10th was broken and the downtrend continued.
- The trading range is the widest it has been all year measured by the ATR at 5.95. The best day traders have more room to work intra-day if they can get on the right side of the move.
- The MACD continues to be in a bearish cross under since December 7th.
- Huge volume to the downside last week as $SPY was trading over 250 million shares a day on Thursday and Friday.
- There is nowhere to hide in the S&P 500 sector in December 2018 as Utilities $XLU is the last sector trading over the 100 day SMA. In bear hurricanes all sectors eventually sink as money managers have to raise money for redemptions.
- $VIX remains in an uptrend saying the market is currently in an expanding volatility environment.
- The stock market is a confirmed downtrend.
- Stocks as an asset class are currently under distribution.