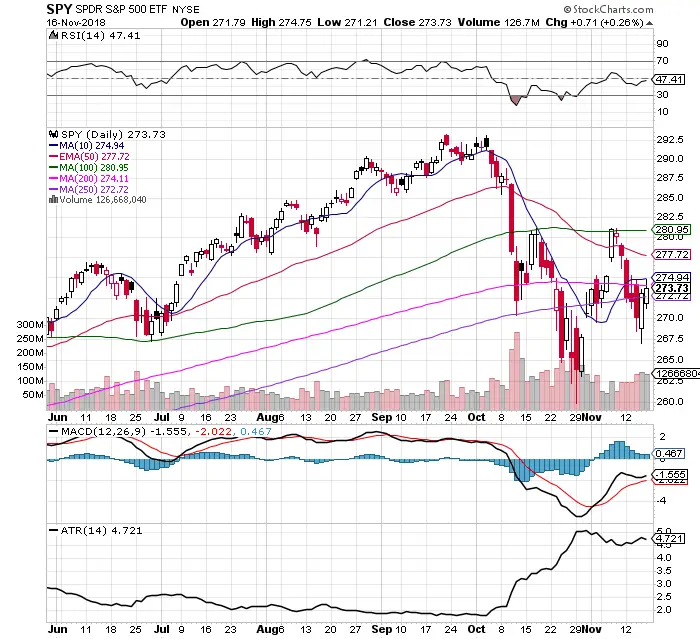
Chart Courtesy of Stockcharts.com
- $SPY closed over the 250 day SMA which is bullish long term trend reversal signal based on backtesting.
- Two bullish moving average crossover signals were triggered with the 10 day / 200 day SMA cross and the 10 day / 250 day SMA crossover.
- The volume on the up swing on Thursday and Friday was higher and the previous down days last week.
- However $SPY remains under the 10 day EMA and the 200 day SMA. They both held as end of day resistance Friday.
- The trading range has declined in November versus the October high with the ATR not making a new high this month.
- Excluding the post mid term election run up and the following day price has closed under the RSI every other day since October 4th. This shows a lack of follow up momentum on every rally.
- The MACD has been under a bullish crossover since November 2nd days after the recent lows.
- $SPY closed under the 200 day SMA in October for bearish end of the month close.
- A close back over the 10 day and the 200 day SMA would confirm another potential bullish reversal.
- A close below the 250 day SMA is a no go zone for bulls.