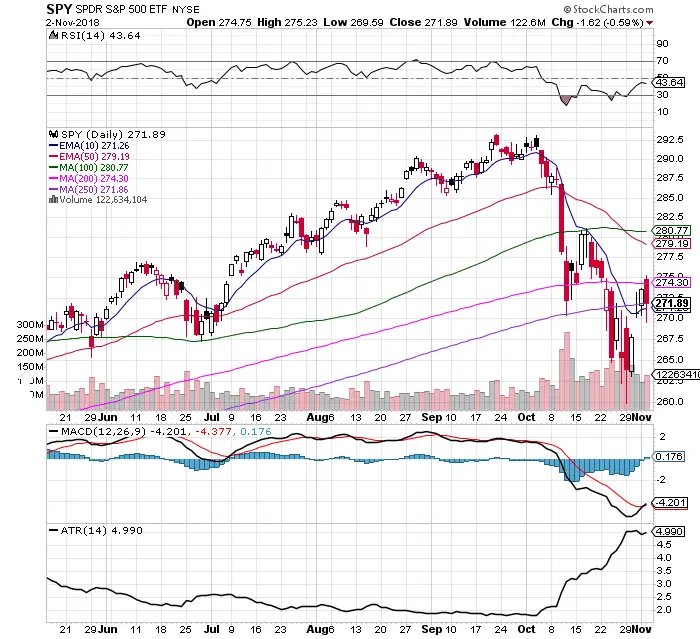
- The break back over the 200 day SMA failed.
- $SPY price is under all key moving averages except the 250 day SMA.
- All bearish moving average cross under signals are triggered.
- $SPY closed a few pennies over the 250 day SMA on Friday. Breaking back over this level and holding is bullish. A close below this level is a sign to exit and wait.
- The $SPY had a MACD bullish crossover Friday.
- The RSI is at 43.64 and has been under the 50 RSI end of day resistance since October 4th. This is the weak side of the indicator. A break back over and close above the 50 RSI would be bullish showing momentum.
- The trading volume on $SPY has doubled since October 4th when the downtrend started showing distribution.
- The U.S. midterm elections on Tuesday could trigger the next trend based on if the outcome is the expected one. Getting past the midterms could signal a return to the uptrend regardless of outcome as the correction has already happened. A relief rally could be in play on Wednesday if there are no negative surprises.
- The $SPY ATR doubled in October to 4.99 giving large trading ranges and creating risk of being on the ride side of daily moves.
- The leading charts in the S&P 500 index are currently $XLP $XLU and $XLU that are defensive sectors.
The odds are in favor of the $260 price on the pin bar candlestick reversal day being the lows for the remainder of the year as we enter the bullish time of the year of November and December. The day after the lows, price rejected the range and gapped up the following day.

Chart courtesy of StockCharts.com