Chart Courtesy of StockCharts.com
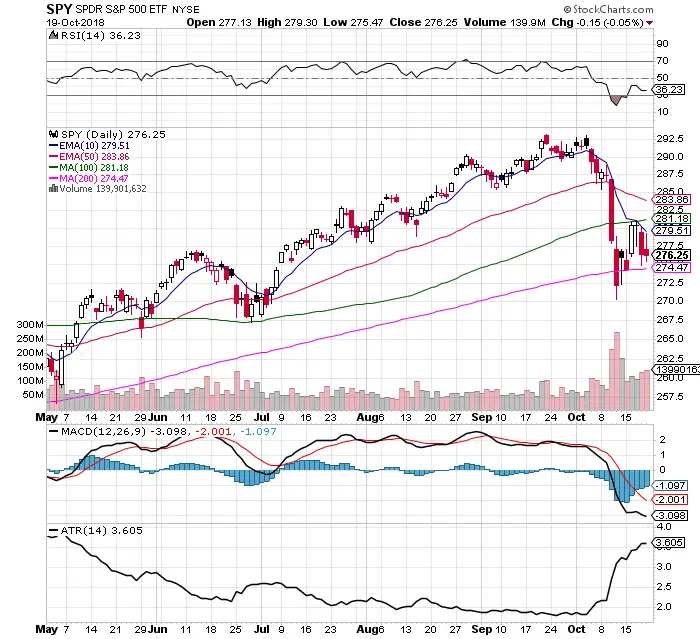
- The $SPY chart that I use that is adjusted for dividends has closed above the 200 day SMA all but once in the past two weeks as the $SPX chart has lost the line multiple times. The chart that I use for backtests and trading has seen buyers show up at this key line during this recent correction.
- The 10-day EMA has remained end of day support last week as the rallies failed.
- The MACD has been under a bearish crossover since September 26th.
- The 36.23 RSI is close to oversold levels giving the best risk/reward ratio to the longs and the upside. A close under the 30 RSI would open up the danger of a parabolic downtrend.
- Thursday’s and Friday’s down days were on higher volume than the Tuesday and Wednesday up days.
- The trading range has almost doubled to a 3.60 ATR in the past two weeks.
- The trading range for prices has been from a $270 support to the $281 resistance for the past seven trading trades.
- Defensive sector ETFs $XLU $XLV $XLP and $XLRE showed relative strength in the market last week along with big cap ETFs $SPY and $DIA.
- $SPY is one of the safer places to hold stock market exposure here with the 30% exposure to defensive sectors.
- Look for the key levels to break as the 10-day EMA reistance or the 200-day SMA support for a potential signal on the next direction of the trend.