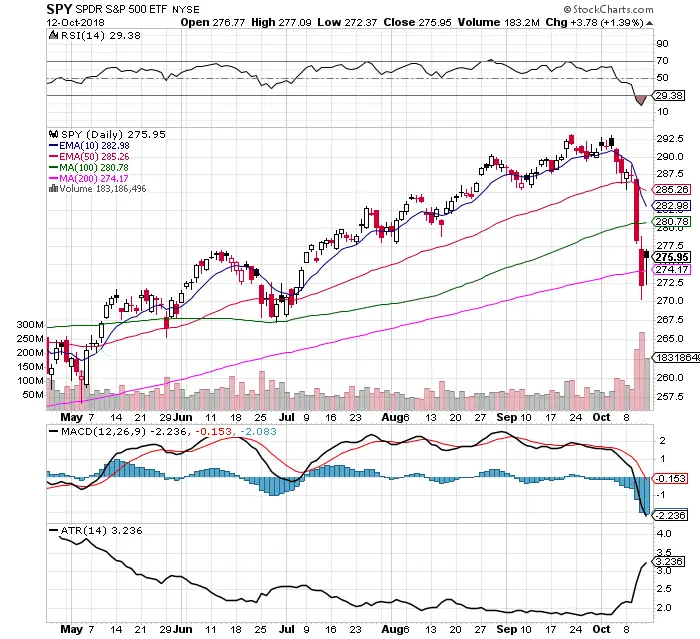
Chart courtesy of StockCharts.com
- $SPY closed back over the 200 day SMA Friday triggering a bullish entry signal.
- A close below the 200 day SMA would negate the bullish signal Friday.
- Friday was an inside trading day with prices inside Thursday’s range.
- Friday had the highest volume up day since the reversal out of the first correction on February 9th marking that short term bottom.
- The VIX stayed above the 200 day SMA last week and is under a 10 day / 30 day EMA crossover signaling an expanding volatility environment. Put option contract in the S&P 500 are now more expensive based on the fear and increase in the Vega pricing.
- The trading range expanded to a 3.23 ATR the largest trading range since May. Giving day traders and swing traders more room to work.
- The RSI is oversold with a close below the RSI 29.38. It is dangerous to be below the 30 RSI, but a close above the 30 RSI is a reversal long signal.
- A new 10 day / 50 day EMA crossover would be a new long side trend signal.
- $SPY is a good risk on position in this environment due to the exposure to the utilities, consumer staples, and healthcare could help limit any further losses if this upswing does not materialize.
- Money is made during corrections by the people that have the cash and the plan on how to get back in before the next upswing happens.