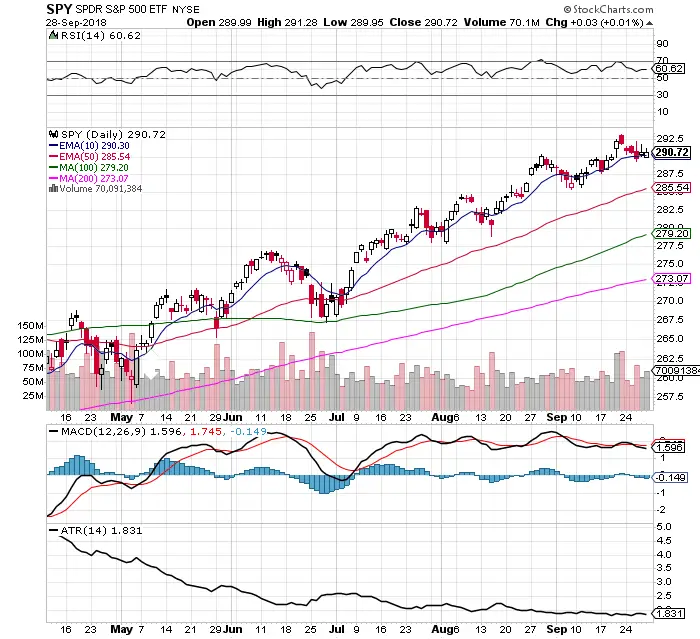
Chart Courtesy of StockCharts.com
- $SPY remains near all time highs of $293.22. It is bullish to be within striking distance of all time highs.
- Price remains bullishly over all moving averages.
- $SPY lost the 10 day EMA as intraday support last week showing the market starting to go sideways in a range.
- $SPY has been under a bullish 10 day / 50 day EMA crossover since May 16th with no pullback.
- The MACD has a bearish cross under here showing the loss of momentum higher.
- Last week’s churning in a tight price range last week was on higher than average volume.
- RSI is showing momentum at 60.62 but not overbought.
- The trading range remains very tight with a 1.83 ATR. There is not enough volatility for swing trading or day trading in $SPY.
- This market is ideal for buy and hold investors and trend followers.
- This market environment and chart still favors buying the dip, not selling short.