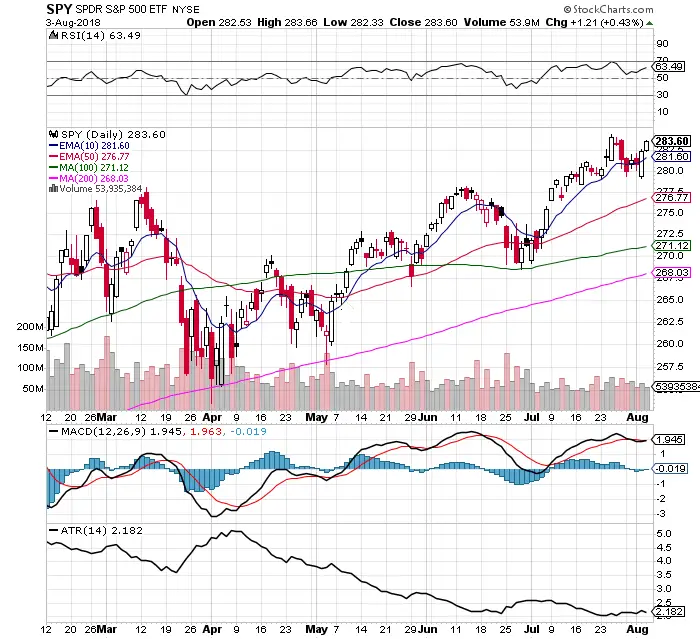
Chart courtesy of StockCharts.com
- The current short term $SPY trading range is resistance at the adjusted all time high of $284.37 and support at $278.50 since July 13th.
- $SPY remains within striking distance of breaking out to new all time highs at an unadjusted $286.63. All time highs are bullish. The more attempts to break out the better the odds become that it happens.
- $SPY price is above all moving averages.
- The 10 day EMA / 50 day EMA bullish crossover signal remains in effect.
- MACD had a new bullish crossover last week.
- Thursday was a bullish engulfing candlestick that followed through Friday to go higher.
- $SPY RSI gives price room to go higher before becoming overbought 63.49.
- $VIX intra-day low of 11.07 on Friday was the lowest reading for $VIX since May 2018. Put options are very cheap with little expectation of a downtrend here.
- The ATR (Average True Range) has stayed the same over the past month as the current trading range held with little volatility currently.
- Volume was steady last week as $SPY held the lows of the range and reversed to pursue a new breakout to new all time highs.