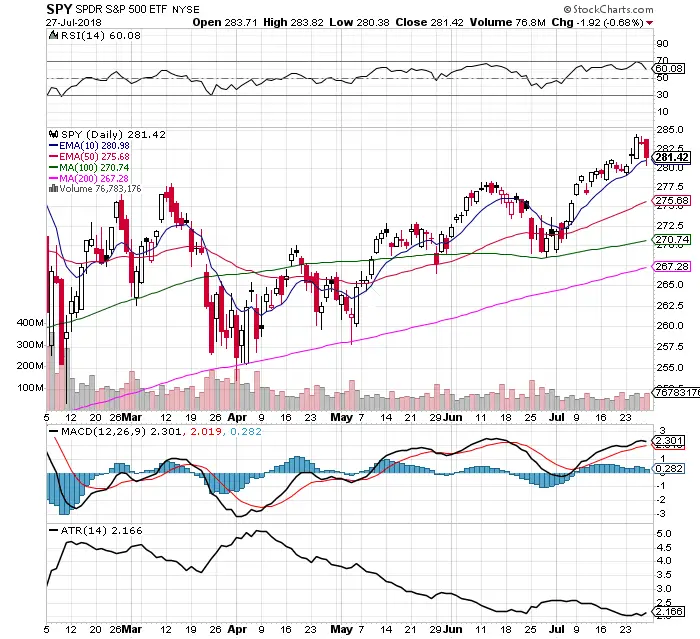
Chart Courtesy of StockCharts.com
- Price remained above all key moving averages except the 5 day EMA, showing a loss of momentum.
- The 70 RSI acted as end of day resistance on Wednesday.
- The 10 day EMA acted as end of day support on Friday.
- Last week has a small increase in the Average True Range of trading but stayed historically low.
- MACD remains under a bullish crossover.
- $VIX remains inside the weekly range at historical low levels as 13.03 after spiking higher Friday.
- Volume continues to stay steady and consistent in both up and down days. No clues there.
- Pull backs in other index ETFs $IWM and $QQQ may lead $SPY to a larger pullback.
- Market leaders had historical sell offs last week Facebook and Twitter in instant bear markets dropping over 20%. this is not what you want to see with market leaders in bull markets. Amazon and Google had great earnings but did not trigger a sustained up trend in those market leaders.
- I continue to look for pullbacks to buy and for trailing stops to take me out of the rest of my long trades $DDM and $FAS trend trades. I am currently long metal ETFs $AGQ and $UGL as they present better risk/reward ratios. Subscribe to my newsletter for full trade and analysis details on my watchlist three times a week. -> My Technical Trading Newsletter.