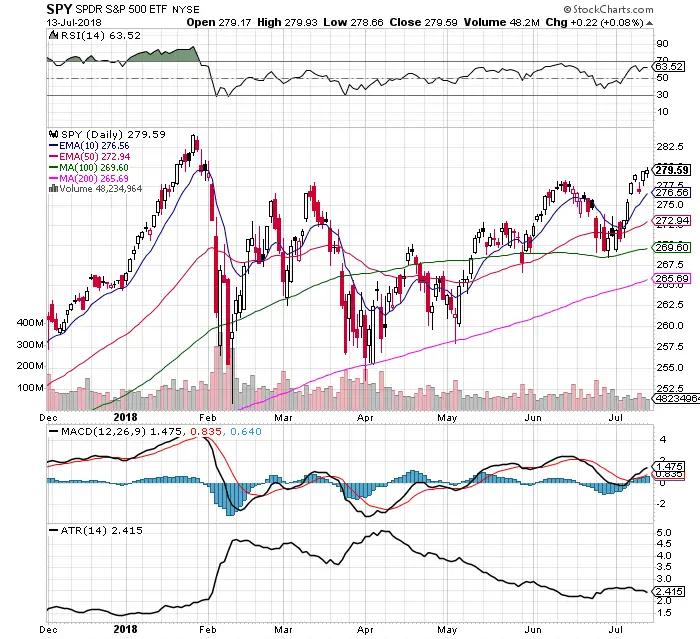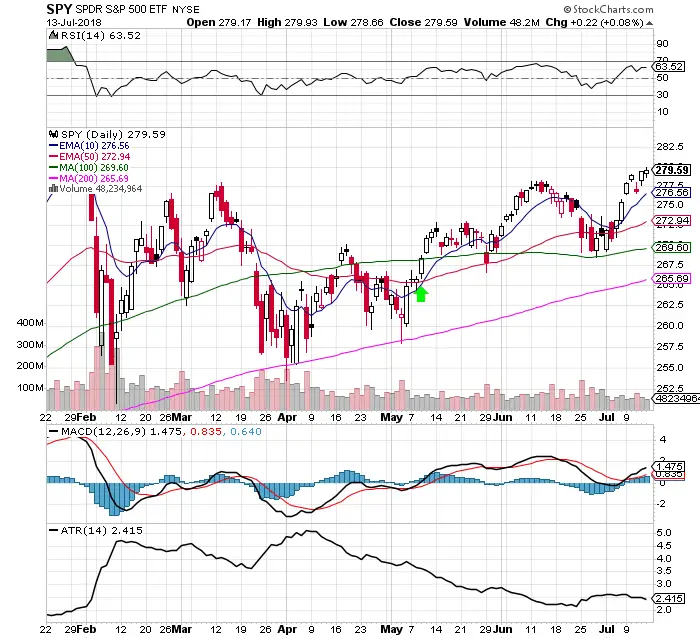
Chart Courtesy of StockCharts.com
- $SPY remains in a huge long term range since the January 26th unadjusted all time high of $286.63.
- Price is bullishly over all key moving averages.
- Last week price formed a price range while elevated over the 10 day EMA. With $276.50 support and $280 resistance.
- The 10 day EMA has remained over the 50 day EMA after the May 9th crossover.
- RSI is at 63.52 which is not overbought and has room to trend higher.
- The MACD remains under a bullish crossover.
- The $VIX at 12.18 is very low historically.
- The Average True Range (ATR) has stayed steady at 2.41. It remains a low volatility market.
- There are 194 stocks at all time highs. 266 stocks are at 52 week highs. This is what a bull market looks like.
- The stock market continues to be led by small caps $IWM and the Nasdaq 100 $QQQ. Big cap ETFs $SPY and $DIA have lagged and they could play catch up into the second half of the year.
