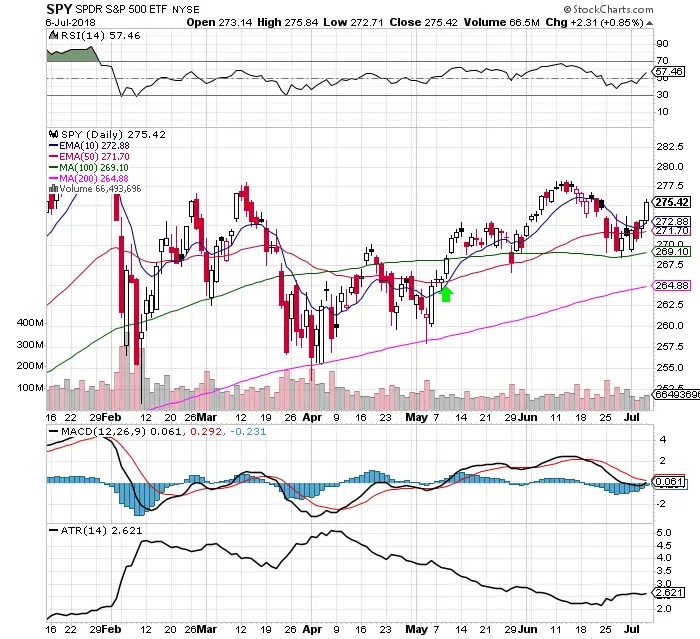
Chart Courtesy of StockCharts.com
- Price is back over all moving averages. This is bullish.
- Last week the 100 day SMA continued to hold as support until $SPY broke out of the two week trading range at $274.
- The next key resistance level on the chart is $278 then all time highs at $286.63.
- Volatility decreased last week trending lower with lower highs and lower lows with VIX ending at 13.37
- The size of the trading range has stayed the same last week at 2.62 as $SPY stayed inside the support and resistance and then broke out.
- RSI at 57.46 returns to the momentum side of the chart and has room to run before becoming overbought.
- MACD remains under a bearish crossover but the signal line is starting to turn up.
- Last week’s shortened holiday week was traded on lower volume than average.
- The leading sectors in the market are $XLU $XLK and $XLE.
- The leading indexes are the small caps and NASDAQ. $IWM $QQQ