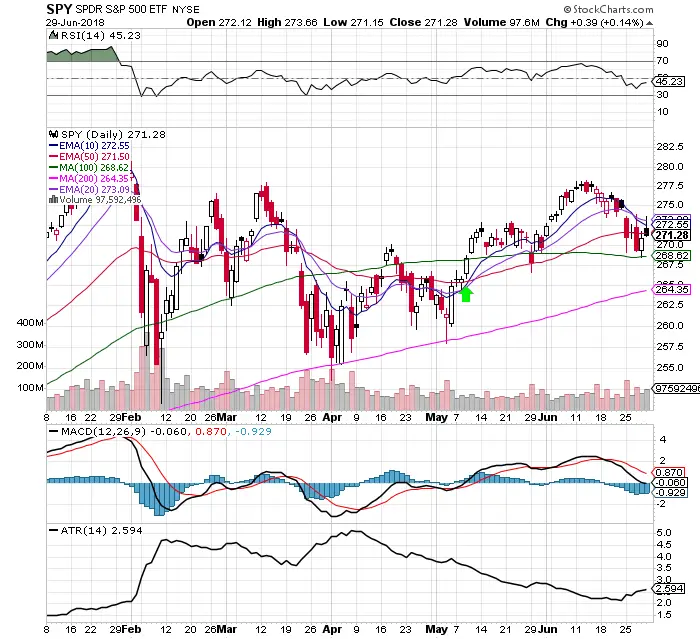
Chart Courtesy of StockCharts.com
- $SPY has traded in a large range so far in 2018 but up slightly +1.94% year to date.
- $274 has acted as resistance last week.
- The 100 day SMA held as support last week.
- The trading range expanded as the ATR trended higher last week.
- The MACD is under a bearish cross under.
- RSI shows lowing momentum at 45.23 with room to go lower before becoming overbought.
- VIX broke out of its range and ended higher last week at 16.09.
- Volume increased last week as the range also expanded.
- Utilities $XLU is the strongest sector in the S&P 500 here. This is a not a bullish sector to be leading the market.
- A great dip buy opportunity would be a dip back to the 200 day SMA or the 30 RSI or a confluence of both together depending on how the price plays out.