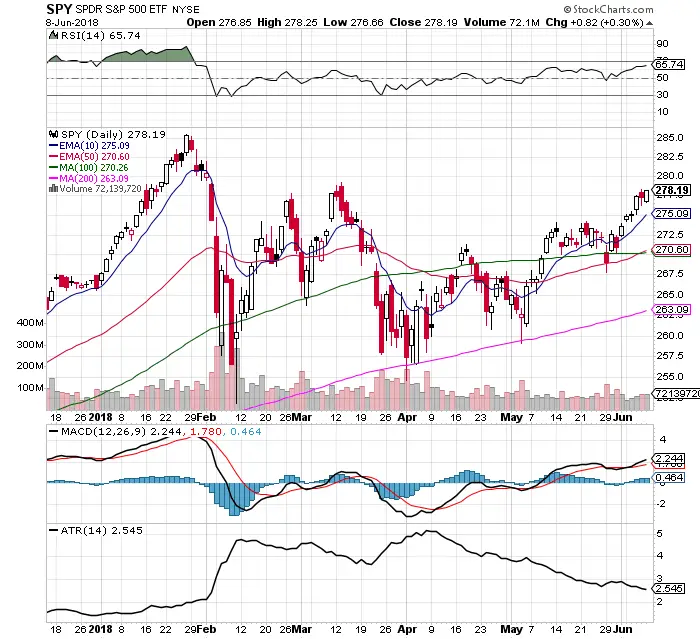
Chart Courtesy of StockCharts.com
- Price remains bullish over all moving averages.
- The 10 day EMA has been the end of day support for six straight trading days.
- New bullish 50 day / 100 day crossover.
- The bullish 10 day / 50 day crossover still in place.
- Volume has been low but increasing as the market went higher.
- The RSI at 65.74 is bullish with room to go higher before becoming overbought.
- The MACD is still under a bullish crossover.
- The Average True Range has continued to decline last week to 2.54. This is bullish.
- $VIX stayed in a range ending at 12.18 which remains historically low and bullish.
- Tech $XLK and the consumer discretionary sector $XLY continue to lead the market higher while consumer staples $XLP and utilities $XLU continue to be the laggards.