Skip to content
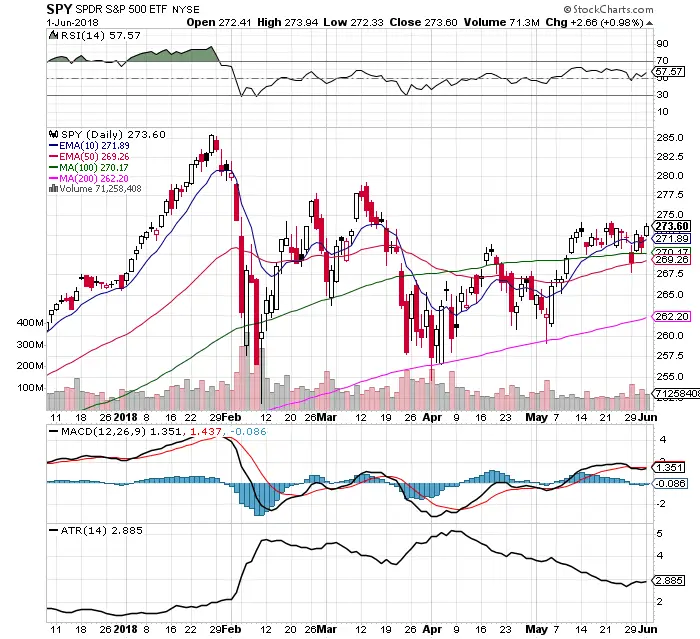
 Chart Courtesy of StockCharts.com
- $SPY has been in a trading range since May 9th with $267 support and $274.25 resistance.
- Secondary support is the 100 day sma.
- The final level of support is the 50 day ema where we did get the bounce back on Tuesday.
- Volume was slightly higher on down days than up days last week.
- The MACD had a bearish crossover last week as $SPY dropped under the 50 day sma on Tuesday.
- The average true range stayed steady last week at 2.88.
- The $VIX dropped quickly to 13.46 last week as $SPY rallied off the 50 day sma.
- RSI is slightly bullish here at 57.57 with room to run higher before becoming overbought.
- $IWM remains near all time highs giving the stock market a bullish bias with the possibility of other indexes returning to all time highs.
- $SPY stays under a bullish 10 day ema / 50 day ema crossover. I remain long here using $SSO.
