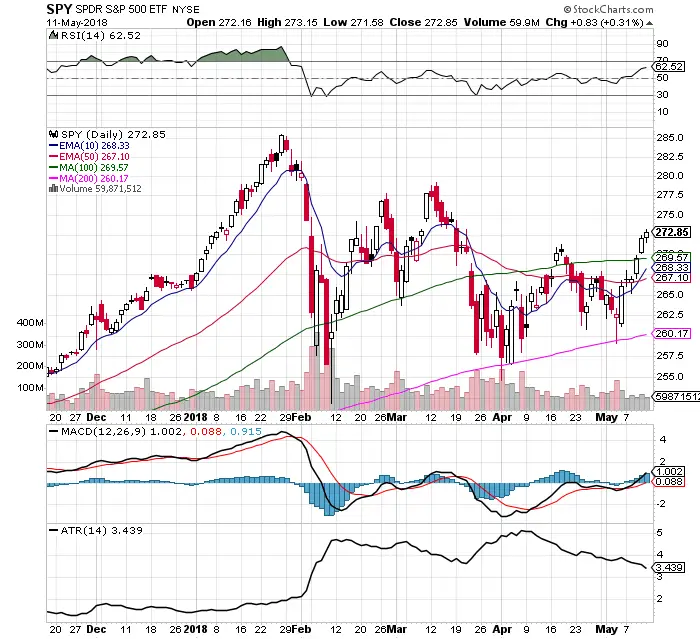
- $SPY has closed at the highest price since March 16th, this is bullish.
- Wednesday $SPY made higher highs and higher lows Wednesday through Friday. This is the definition of an uptrend.
- $SPY had a bullish break over the 100 day sma last week.
- $SPY had a bullish 10 day ema / 50 day ema crossover last week.
- The RSI is bullish showing momentum at 62.52 with room to run higher before coming overbought.
- The MACD is under a bullish crossover.
- The average true range continues to decline to $3.43. This is bullish.
- $VIX had lower highs and lower lows last week falling under the 200 day sma and ending lower at 12.65.
- Price went higher last week in lower volume but each day has been higher over the past 6 trading days.
- Currently the $SPY chart is bullish.
I am currently long $UWM, $QLD, and $SSO.
I’m long $UWM @ $72.39 with the 10 day / 50 day Sma crossover
— Steve Burns (@SJosephBurns) April 16, 2018
I’m long $QLD here @ $80.21 on the $QQQ 5 day / 20 day crossover. pic.twitter.com/IuKmYAdhzV
— Steve Burns (@SJosephBurns) May 4, 2018
I’m long $SSO @ $111.49 after the $SPY 10 day / 50 day EMA bullish crossover.
I’m also still long $UWM & $QLD from last week.
— Steve Burns (@SJosephBurns) May 10, 2018