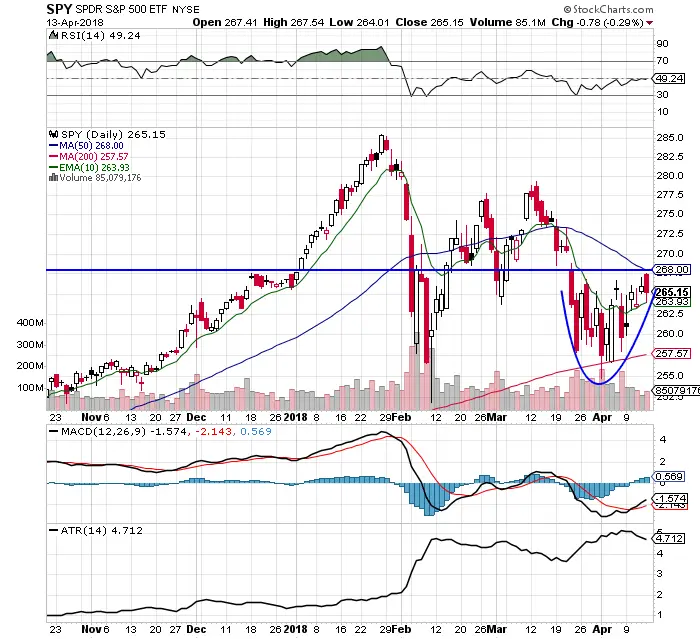
- Short term resistant is at a confluence of the $268 price level, of the 50 day SMA, and the 50 RSI. A close over this level gives a momentum long signal.
- The RSI is at 49.24, a close over the 50 RSI is a sign of new momentum.
- For the past four trading days the 10 day EMA has acted as short term support. A close under the 10 day EMA would open up the potential for a return to the 200 day SMA.
- The 200 day SMA held on the first multiple tests of support.
- A bullish cup pattern formed around the 200 day SMA.
- The MACD is under a bullish crossover.
- The trading range decreased last week as measured by the ATR. This is a bullish sign.
- The $SPY rally to the 50 day last week was on very low volume.
- Last week the $VIX trended lows to 17.41 with lower highs and lower lows.
- The Syria bombing appears to be a non-event and the chart could play out bullishly. It is possible that a plunge Monday could be a buying opportunity.
I am currently watching for key moving average crossovers to the long side for my watch list to enter this market, many are very close. A deep dip buy using oversold readings is my back up plan if I do not get a trend signal. Currently this market is in neutral zone and I am waiting for confirmation signals.