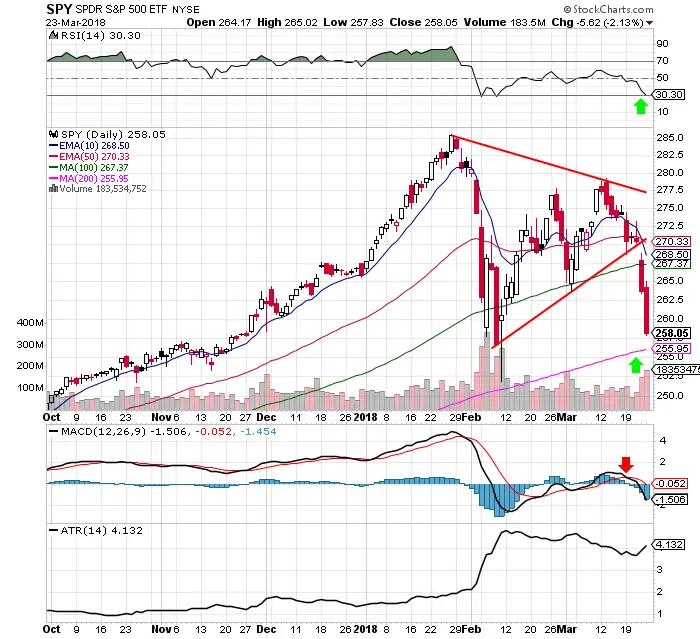
- Last week the $SPY chart broke out of the symmetrical chart pattern to the downside.
- The MACD was under a bearish cross under all of last week.
- The ATR expanded to the upside showing the expansion of downside volatility.
- Volume expanded by over 50% as prices fell to the downside.
- The RSI is entering oversold territory at 30.30.
- $VIX is near the March high at 24.87.
- Remember that in volatile markets prices can move strongly in both directions at any time, the biggest rallies many times happen even during downtrends.
- For swing trading systems the risk/reward gets better as prices enter overbought technical levels near long term support. Dip buys are invalidated if key support levels are not respected by the end of the day.
- The $SPY 200 day SMA moving average is my dip buy technical level if the level holds or price is lost below it then rallies and closes back over it.
- If the $SPY RSI closes above 30 on Monday this is another level I will be looking to buy.
If prices close below the 200 day SMA and/or the 30 RSI this could be a big signal that the potential of a correction or bear market is on the table. Bulls should step in and defend these levels next week if the market is still under accumulation.
I am currently flat and looking to buy the dip.