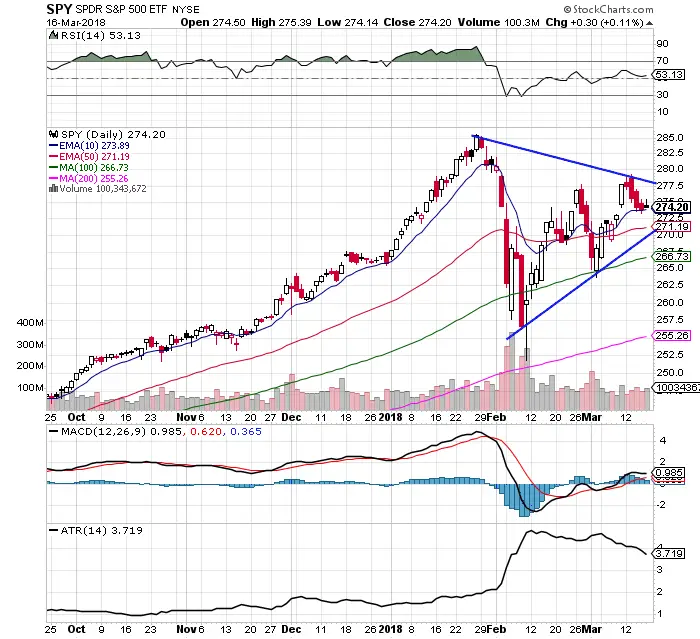
Chart Courtesy of StockCharts.com
- Last week $SPY retraced the previous big bullish candle ending lower.
- The 10 day EMA acted as end of day support last week.
- Price remains bullish and over the key moving averages 10 day, 50 day, 100 day, 200 day.
- $SPY is trading inside a price range that is consolidating.
- There is the potential of the symmetrical triangle chart pattern forming with the lower highs and lower highs so far. This is a neutral chart pattern so far.
- The trading range has decreased steadily for the past 2 weeks with a declining 3.71 ATR.
- Volume has remained the same on the swing up and the swing down recently.
- The MACD remains under a bullish crossover.
- RSI is neutral at 53.13.
- $VIX has remained steady at 15.80.
The market has moved into a compressing trading range but is still leaning bullish here so far. I am currently long $SSO $UWM and $ERX.