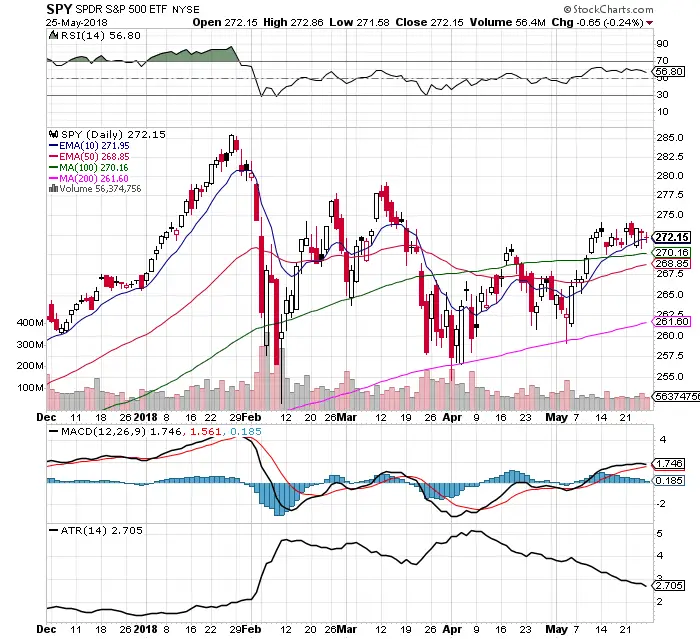
- Since breaking out over the 100 day SMA $SPY has been trading in a range with $274 acting as resistance and $270 as support.
- The average true range that $SPY is trading in continued to decline in May. With the ATR at 2.70. This is bullish.
- Price remains bullishly over all moving averages.
- $SPY has closed above its 10 day EMA for the past 12 trading days as it acts as end of day support. This is a very bullish sign.
- $SPY is still over the 10 day EMA / 50 day EMA crossover. This bullish signal back tests well.
- MACD continues to stay under a bullish crossover.
- RSI is slightly bullish at 56.80 showing some momentum and has room to run higher.
- Volume on the $SPY chart had down days slighter higher than up days last week.
- $VIX finished last week with three straight days of lower highs and lower lows on the last three days finishing at 13.22. This is still very low historically.
- $IWM has been leading the stock market higher as it stays within striking distance of all time highs.
I currently have bull signals in this market and I remain long $BIB $UWM $DDM $SSO and $QLD.