This is a guest post by Drew Hilleshiem , he is the Co-Founder and CEO of OptionAutomator.com, you can follow Drew @OptionAutomator on Twitter.
5 Options Trading Strategies that are Less Risky than Buying and Selling Stock
Do you know what’s inherently more dangerous: a knife or a gun? Don’t Google the answer because all you’ll find is some politically charged entertainment. Ignoring the debate (and answering the question entirely), you could say that neither is more dangerous than the other; it only matters in whose hands the instrument is held.
The same is true with options trading. It’s unfair to say options are riskier than stock or vice versa; it depends on how they are used.
Today I won’t argue for options, but I will show you 5 simple options strategies that you can use that have less inherent risk than buying and holding stock.
Ground Rules Before We Start:
– Options give rights to 100 shares of stock. Therefore, the comparison assumes the equivalent 100 shares in the comparison stock-only position.
– There’s no such thing as a free lunch, and especially not on Wall Street. All strategies introduced may have less notional risk than stock, but are coupled with tradeoffs.
– Reduced risk does not mean no risk. If it seems “too good” then something is missing.
– The introduction given on all these options trading positions are a starting point only. Make sure to get proper education (like New Trader U) before you start trading.
Let’s have a look at 5 options setups. We’ll start off slow with a bit of extra explanation and speed up as we go.
It’s important to note that this list isn’t exhaustive. However, it strikes a good balance between protection/reward and are all simple strategies to execute.
Here they are, 5 options trading setups inherently less risky than stock:
5 Options Trading Strategies Less Risky Than Stock:
• Covered Call; sell a call for income and reduced cost basis.
• Collared Stock; sell a call and buy a put to cap potential losses.
• Short Put; like a covered call without the stock.
• Risk Reversal; a synthetic stock position using only options
• Calendar Spread; low risk way to capitalize on time and volatility
Strategy #1 – Covered Call Writing – Reducing Risk by Reducing Cost Basis
Covered calls are the easiest way for someone new to options trading to learn the tricks of the trade while enhancing their income and taking risk off a stock position. In fact, their use has grown so much in popularity there are now many ETFs on offer which run this strategy.
The mechanics are simple, for every 100 shares of a stock you own you can sell a single call contract. This call that you sold is held by the buyer and gives him the right to purchase your shares before the contract expires at the contract’s agreed price, or “strike price”.
You only need to select which price and expiration date when offering the contract. The closer the price to the current price of your shares and the further away the expiration, the more money you will receive but also the more upside you sacrifice.
I would like to mention quickly, that there’s another strategy called a “Deep-In-The-Money Covered Call”, which is very similar but turns stock into something resembling a short-maturity bond. Unfortunately, we won’t have time to cover in this article. Leave a comment if you’d like to see a follow up article on the subject.
Comparing Risk via Risk Plots:
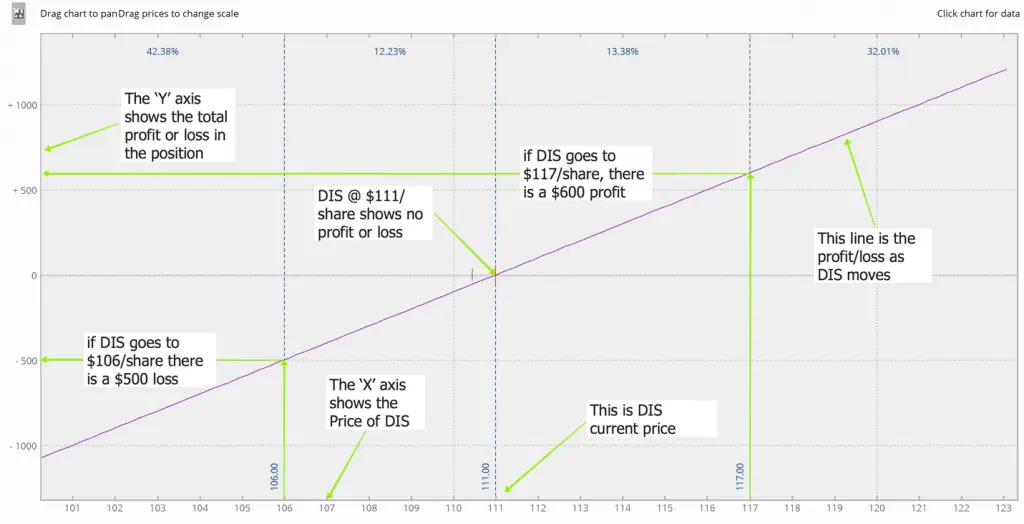
If you are unfamiliar with a risk plot, don’t worry, it’s a simple concept. The plot shows the amount the position will profit or lose (y-axis) based on movement in the stock (x-axis). For stock, this is a straight line, let’s take Disney (DIS) as an example with some annotations to help you understand the basic concept:
Risk Graph DIS Stock Purchased at $111/share:
The current price of DIS is at $111/share and this is where the line crosses the y-axis. If the stock moves down from there to $110/share you have lost $1 per share for each of your 100 shares or a total of -$100. If we go back to the current price and move up $1/share you will have a $100 profit.
So for each $1 move in DIS we see $100 of profit or loss. Let’s now take a look at a covered call.
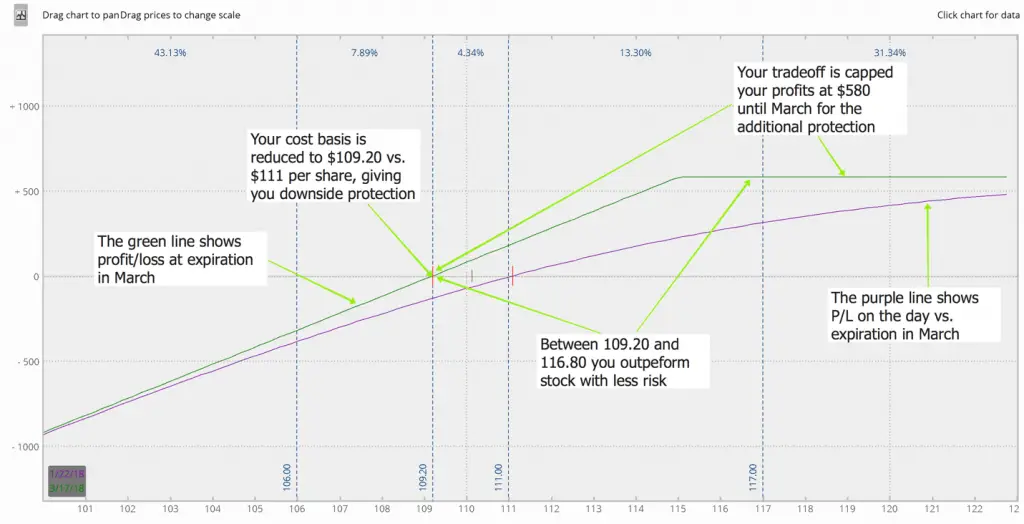
Risk Graph DIS 115 Covered Call:
So, if we sell a call at $115 for the month of March (52 days left in the call), the buyer of the call would take your stock and profits above $115. The buyer pays you $1.80 for the call option, so your cost basis in DIS is adjusted to $109.20 ($111/share less credit of $1.80 received for selling the call).
Let’s say that at the day of the contract’s expiration, DIS decreased to $101/share. Holding just the stock you would have lost $1000. By having adjusted your cost basis from $111 to $109.20/share you would have lost $820 versus $1000.
What if DIS went up to $117 per share? Well, the holder of the option would force you to sell your shares at $115 to him, but since he paid you $1.80 for the call option you basically broke even with holding the stock ($115 + $1.80 = $116.80).
Anything above $117 at March expiration (52 days) and your profits are capped at $580.
Comparing this against stock, between $109.20/share and $116.80/share you outperformed your stock holding friends while taking on less risk in the position.
It’s important to note that the call is only valid until March expiration (52 days away). If the DIS stays below the 115 strike price, then we keep the $1.80 profit/cost reduction and can repeat the sale of a call in the next month(s). This allows you to continue to reduce your cost basis and increase protection against adverse moves in the stock.
What are the Tradeoffs?
Covered calls give you a great way to lower your cost basis by collecting income on your shares. However, this isn’t free. If the stock rallies you will only get to participate up to the strike price and the holder of the call you sold will “call away” your shares, forcing you to sell the shares at the strike price chosen. That why it’s important to choose your strike carefully and give yourself some room to profit.
Strategy #2 – Collared Stock – Put Protection Bought with Call Premium
Collared stock, or, simply ‘collars’, are very similar in their approach to a covered call. However, they do add another option contract into the mix. In this strategy we start with a covered call from the example above but instead of taking the premium from the sale of the call to reduce the position’s cost basis (read, putting cash in your pocket), you take the proceeds from the sale to purchase a put option for additional downside protection.
That put option will give you the right to SELL your shares at the chosen strike price. No matter what happens, you have the right to sell your shares at that agreed (strike) price. Think of purchased put as the most robust stop-loss that money can buy.
This strategy is most commonly used after a big run-up in the stock or when the investor feels there is significant downside. A collar can be tuned to take significant or all remaining risk out of the stock position. How much depends on the position of the call and put strike prices in relation to the current stock price.
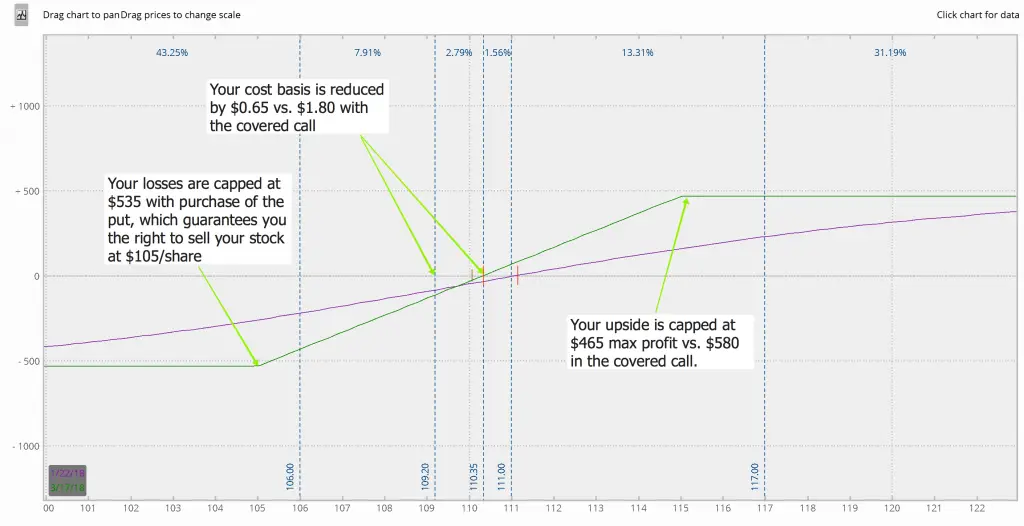
In our current DIS example we collected $1.80 for the sale of the 115 call in March, now which put should we buy? Well, the 110 put costs $2.75 and the 105 put costs $1.15. We have a tradeoff here and decision to make. Either we can buy the 110 strike which gives us near full protection or we keep a little risk on in the position and buy the 105 strike instead.
Since we took in a $1.80 credit for selling the call, we don’t have enough money from the call to purchase the 110 put for $2.75 and therefore would have to pay $0.95 for the protection. This is a bit steep, so let’s go for the 105 strike put instead. In this position we keep $0.65 cost basis reduction.
Therefore, let’s look at the risk plot of the MAR 115 CALL / 105 PUT collar:
Risk Graph DIS MAR 115 CALL / 105 PUT Collar:
The Tradeoffs:
This type of strategy looks to take off as much risk as possible from the stock. In fact, if we chose the $110 put we would have eliminated all but $1 of risk. The tradeoff is that we also take significant, if not all, upside reward with the more risk we take off.
In effect, it’s almost as if you are selling the stock. For that reason, I’m not a big fan of this strategy. If you believe you need to take all risk out of a trade, then why not simply sell the stock? It’s used more by institutions and hedge funds to optimize tax and prevent moving the markets by selling a position. For at home traders, I would stay away.
Strategy #3 – Short Put – the Stock-Free Covered Call
Now we throw away the stock for a second and do what is known as a short put or naked short put. Nothing bawdy to see here – all you are accomplishing is writing a put in exchange for the premium, or the credit to your account from selling the put. In effect (or ‘synthetically’ as options traders say), it is the same as a covered call, but without the stock.
By selling the put, you are obligated to buy shares from the counterparty at the strike price if they choose to execute the contract. You would sell a put when you expect the stock price to go up or stay close to the current price. If the stock goes up, you keep all the money you collected from the sale of the put.
Another interesting way that writing puts can be used is to allow you to be “paid to wait” for a price pull back to enter the stock. In this case, you are paid to take the risk of another trader’s stock but you actually hope for a pull back so the option is exercised by the holder and you take delivery of the shares. This is great when markets are high and you feel that you’ve “missed the run”.
But what if the price goes down and you don’t want the stock? Well, the premium offsets the decline in the price of the stock in the same way we saw with the covered call.
In contrast with stock-only positions, if the price falls, there is no offset for this decline. So in the case of short puts, even if the company goes bankrupt overnight, you will have lost less than our stock trading colleagues.
Risk Graph:
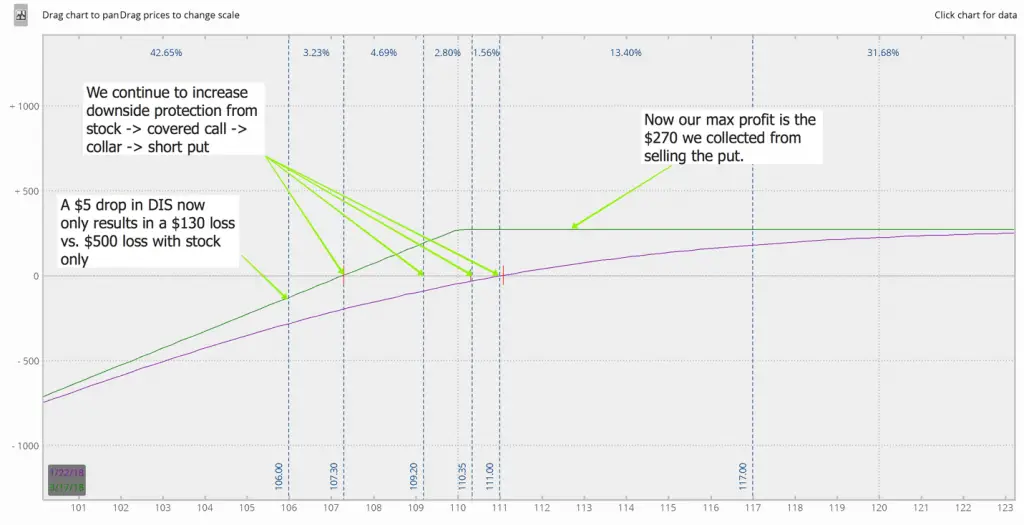
Since we already looked at a covered call vs. straight stock, in the following risk graph we will compare the risk reduction across the three strategies introduced so far.
Risk Graph DIS 110 Short Put:
You can see in the risk plot above that we’ve reduced our risk even further. Now we will make money so long as DIS stays above $107.30 per share. However, do you remember that there is “no free lunch”? Well, this still holds true. To enjoy the lower break-even point of $107.30 per share, we have traded even more of our upside potential. Now our maximum profit is $270 vs. $580 with the covered call or versus the ‘unlimited’ upside with the stock.
You might be asking yourself, “is this a good tradeoff”. The answer is entirely personal and dependent on your trading objectives. I would say this is an OK trade, but market conditions make it less attractive than usual.
See, generally short puts outperform covered calls in risk-reduction/profit-cap tradeoffs, but unfortunately is not true in current market conditions. The reason for this is outside of the scope of this article, but for a very quick introduction there is a concept in options trading called the “volatility smile”. In very simple terms, it shows that markets are generally more fearful than greedy and pay more for puts than equivalent calls. In today’s voracious bull market, the smile has reversed, which is fairly uncommon.
Finally, it’s important to note that there is a lower capital requirement for these trades as you are not purchasing the stock. This is a form of leverage, so use it carefully. Generally, for beginner traders, it is best to approach short put trades with the expectation that you may be forced to buy the stock at the strike price of the put you sold. It’s very prudent to keep aside sufficient money in your account to buy the stock if you are assigned.
Tradeoffs:
Short puts and covered calls have similar tradeoffs to owning stock. Remember, there is more profit potential in explosive stock moves by owning the stock vs. holding a covered call or short put. For example, think of earnings announcements with good news; but, generally, these events are low probability.
Another tradeoff is that compared to covered calls, a short put doesn’t have stock in the position, so the trader will need to be active every month to stay invested.
Strategy #4 – Risk Reversal – Playing for Explosive Moves
With options, we focus on what is known as implied volatility (IV). Think of IV as the expectation of volatility over the life of the contract based on current market pricing of options. A bit of an abstract concept, so perhaps this is easier: when the market falls, IV increases and conversely when it rises, IV decreases. That’s because the market becomes more fearful when stocks fall and more complacent as stocks gain.
A risk reversal synthetically mimics buying stock. They are constructed by selling a put (our short put again) and then using those proceeds to buy a call.
The difference to stock is that these positions take advantage of volatility smile (I briefly introduced before), allowing you to spread out the exercise prices to take further advantage of volatility differences. These positions really shine on durations of 90 or more, making the use of LEAPS valuable to avoid short-term gains.
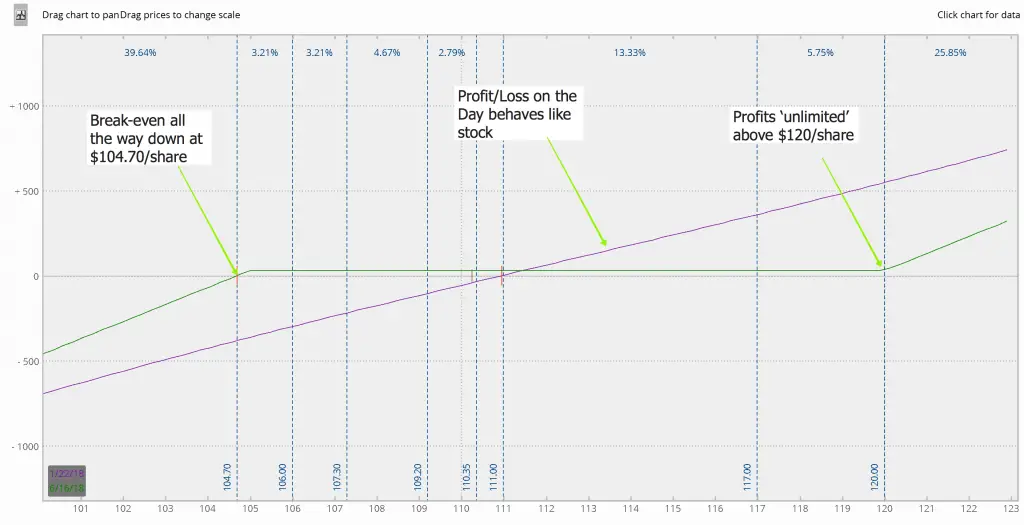
The Risk Graph below is for DIS again. This Risk Reversal involves selling a put at 105 and using the proceeds to buy a call at $120. Both contracts expire in June (143 days away).
Risk Graph of a DIS 105 PUT / 120 CALL Risk Reversal:
You’ll notice that the Risk Graph looks very similar to stock except for a wide range of $30 profit from $104.70/share to $119.70/share. This works great with explosive growth stocks, e.g., Tesla. Perhaps you’re really keen on what Elon is doing with electric cars but you don’t want the bumps and volatility along the way. This is a great way to participate to the upside while taking off significant risk if the stock falls.
Also important to note that the green line on the risk graph is the profit or loss (P/L) at expiration in June while the purple line is the P/L on the day. In other words, if DIS went up to $117/share tomorrow you’d see approximately a $360 profit.
Tradeoffs:
A risk reveral is a great way to play a hopeful big move up in a stock. However, the trader doesn’t get to participate in the area between the put and call.
Strategy #5 – Put Calendar Spread – Graduating to Volatility and Time Decay
So far we have discussed options trading strategies that trade upside potential for downside protection. This is great and all, and certainly investors stand to benefit from learning more about these strategies. However, I think it’s time we graduate from directional trading into other low-risk alternatives.
When we trade a position that has direction there is one glaring risk that won’t go away anytime soon: the risk that we’re wrong on the future direction of the stock.
With options, we don’t have to trade a direction, that is, we don’t have to choose if a stock or ETF will increase or decrease in value. Instead we can trade volatility and time decay and one of the lowest risk ways to get your feet wet is with the calendar spread.
You create a calendar spread when a near-term put is sold and the same put is bought but with a later expiration. For example, you sell the February 110 put and buy the March 110 put. Since the pricing is based on where the stock might go, the more time the option has the more expensive it will be. Therefore, a calendar spread will be for a net debit in your account.
But why would we want to do this? Well, to take advantage of time and volatility changes. Sounds exotic, but these slow-moving instruments are about as exciting as watching paint dry – in trading, less excitement usually means less risk.
How do you make money?
Simple, as we move closer to the expiration of the first put contract, its value will decrease by more each day than the longer dated put so long as we stay close to the current trading range. This means that you are taking advantage of the time decay of the short put (the put you sold) and should see a steady tick up in profit so long as we stay in the range.
Don’t wait until expiration or max profit, usually shooting for 15-25% of the max return is reasonable and gives us a nice profit.
Compared to 100 shares of stock and having to guess a direction we can trade a calendar at a small fraction of the cost and with much less risk of the stock moving against us.
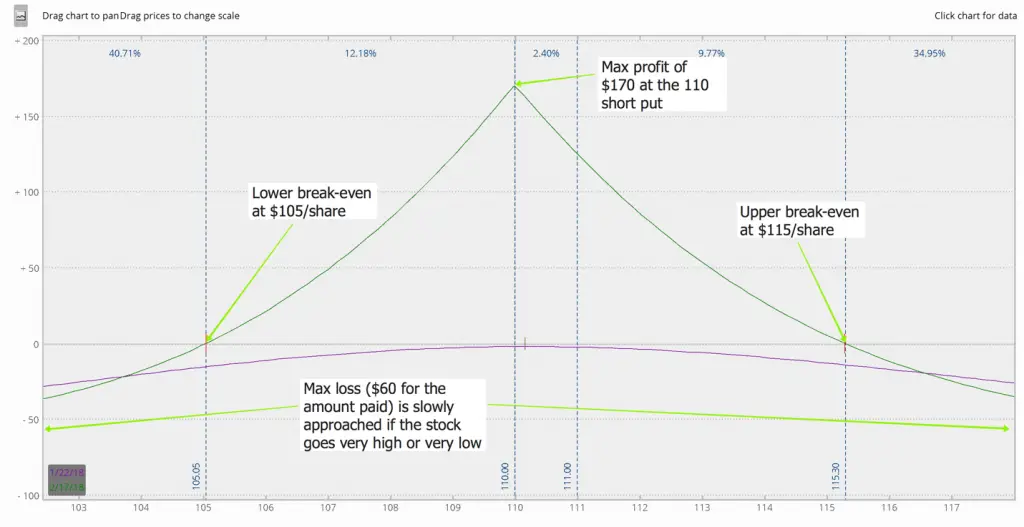
Risk Graph DIS 110 FEB/MAR CALENDAR:
It’s interesting to compare the risk graphs between stock and a calendar. There is a huge area to break even. So long as the stock stays between approximately $105/share and $115/share then we stand to profit.
The risk/reward is also compelling, as we stand to make up to $170 and only risking $60. In fact, at the position this size, we’d likely trade multiple contracts. If we traded 10 of these spreads we’d risk $600 to make up to $1,700.
Calendars are also interesting in a bull market. See when volatility is very low selling puts become less attractive, but a calendar preserves it risk/reward tradeoffs much better than the short put and actually benefits if volatility returns to the market.
Tradeoffs:
Calendars are great positions, especially in low volatility. However, it’s a fairly significant move from stock trading. Also, the timing is difficult. Many traders hold these until the first contract expires hoping to land on the maximum profit. Instead, a good rule-of-thumb is to sell your calendar as soon as you’ve realized 15-25% of the max profit.
Options or Stock: What Do You Think is Riskier Now?
Sorry, the answer is still: “it depends”. However, I hope after reading this article that options will be less dangerous in your hands. You’ve now seen 5 strategies with less risk than stock and should have gained a bit more insight on how to use options to create profit opportunities with lower risk exposure than simply owning stock.
The use of any of these 5 strategies can certainly become the basis for you learning how to effectively integrate options trading in the overall management of your portfolio and will set you up properly to be able to wield this powerful weapon of the trading world with safe hands.
Would love to hear your thoughts and answer your questions in the comments below.
About the Author:
Drew Hilleshiem is the Co-Founder and CEO of OptionAutomator.com, an options trading technology startup offering a free options screener that leverages Multi-Criteria Decision Making (MCDM) algorithms to force-rank relevancy of daily options opportunities against user’s individual trading criteria. He is passionate to help close the gap between Wall Street and Main Street with both technology and blogging. You can follow Drew via @OptionAutomator on Twitter.
For a quick education on options and potential strategies check out my Options eCourse here: 
