This is a guest post from the website professionaltradingsystems.com
In this article I would like to touch upon a very often neglected topic: trading costs. Many of us – traders – for some reason are not cautious enough regarding the matter and there are many examples of failed live trading results because of incorrect trading cost estimation during the backtest period. Today I will present to you how a small change in spreads will reduce your trading profits significantly.
The strategy
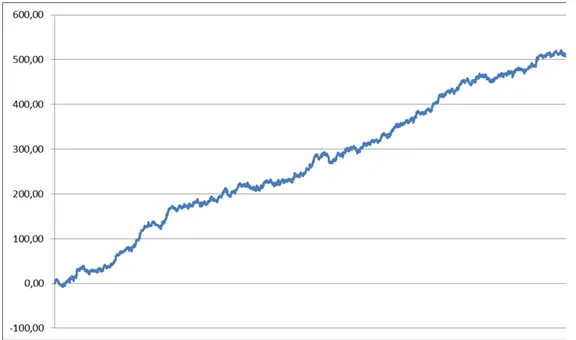
For the above stated purpose I will use a swing trading Forex system, which should also be considered as very short-term. Its concept is based on a sideways detector indicator which monitors for flat markets when the prices are not trending in either direction. Once we have such a juncture the systems looks for RSI overbought for a sell signal and RSI oversold for a buy signal. Below you could see the equity curve where all trades are converted in R-multiples in order to be equalized:
R-multiple is a ratio which divides a trade’s gain by the amount of its initial Stop Loss. So if a particular trade has gained 150 pips and its stop loss is 120 pips, then it is 150/120 = 1.25 R.
The conversion is done in order for every market to be equalized, every trade to have equal weight across different market cycles with changing volatility for the trades to be treated equally. So with this ratio I could be comparing 10 points gain in Gold with 120 pips on eur-usd and 50 pips during a quiet market to a 200 pips gain during a wild juncture.
The backtest has been done for 15 years – from beginning of 2001 to the end of 2015. The portfolio consists of 7 markets – eur-usd, usd-chf, gbp-usd, aud-usd, usd-jpy, spot Gold and gbp-jpy. Totally the trades are 11 531, which is 739 per year or 15 per week. Here are the spreads used in the backtest:
| Market | eur-usd | usd-chf | gbp-usd | aud-usd | usd-jpy | gold | gbp-jpy |
| Spread | 0,9 | 1,6 | 1,4 | 1,3 | 1,0 | 0,43 | 1,8 |
Currency pairs spreads are in pips displayed and the Gold is in points. These spreads are a little bit optimistic and unless you are using a true ECN broker you will experience difficulties finding a broker with such spreads. The difference between the spreads across the brokers comes from the fact that each broker has a various access level which determine the bid/ask difference. The deeper the access, the better the conditions. Also when you have a big account you will get better conditions (spreads). And the third factor is the quality of the liquidity providers to the broker which is connected to the first factor.
The total return is 521 R and the Max draw down is 22 R. These results are not bad at all because average annual return/MaxDD ratio is 1.57. This means that if you limit your MaxDD to 20% using the appropriate money management, then you could earn 31.4% on average per year.
In order to show you the effect of changing the spreads I have done a second backtest with absolutely the same inputs but with a bigger bid/ask difference. Here are the new spreads used in the new backtest:
| Market | eur-usd | usd-chf | gbp-usd | aud-usd | usd-jpy | gold | gbp-jpy |
| Spread | 1,1 | 2,1 | 2,0 | 1,9 | 1,8 | 0.50 | 3,3 |
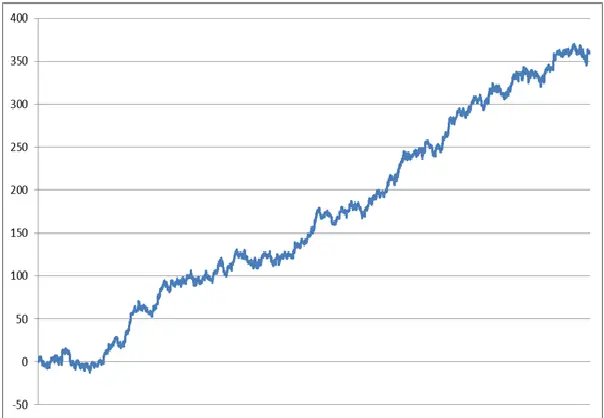
On average these spreads are 50% bigger than the first ones and they are quite conservative. The total return for the period is changed to 361 R which is 30% less and the MaxDD has increased from 22 to 28 R which is 22% rise. Annual return/MaxDD ratio is down to 0.86 – a 45% decrease compared to the first test. Below is the new equity curve:
As you see a small change in spreads could cause much worse system performance. I should reiterate that this is a swing trading system which has 15 trades per week. If you make the same spreads change for a day trading strategy with 50 trades per week the deterioration of the equity curve could be much bigger and you could even end up with a system which is no longer profitable. On the other side if you try the same procedure with long-term trend-following Forex strategy with 20 trades per year, then the difference in the results will be negligible.
The solution
There are two options which can be taken in order to avoid any big difference between backtested performance and then real time trading results of your system. The first one is focusing on algo strategies with high average trade measured in pips (points). Such systems are least dependent on increasing of spreads and other trading costs like commissions and slippage. A strategy with an average trade of 8 pips is very stable because even if you subtract 0.5 pips per trade additional costs then you will end up with 7.5 pips which is only a 6.5% decrease. Most the time this means using trading systems with less activity and avoiding any day trading strategies.
The second option is to make your backtest with the real spreads which your broker offers to you and then to make a little mark up for any additional and hidden costs like slippage. Being conservative at this stage is very useful for your live trading results because you are not going to be caught by surprise.
I hope I have brought some clarity regarding the trading costs of an algo systems and how a little difference could make a huge impact on real trading results. I wish you profitable trading.
You can check out their website at professionaltradingsystems.com

