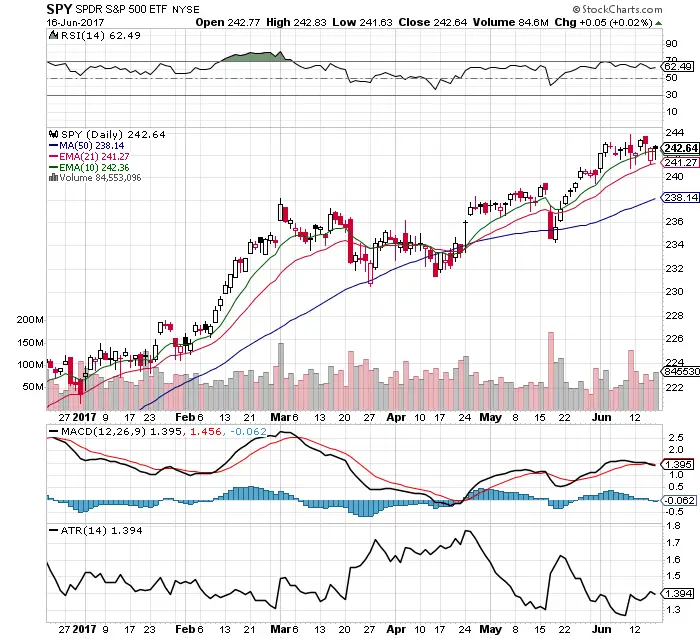
- SPY remains bullish as it is near all time highs.
- SPY has been in a trading range for two weeks $244 resistance and $241 support.
- The average true range for price expanded last week to give day traders more room to work.
- $VIX remains low at 10.38 with resistance at a 12 VIX.
- The trading range has expanded as the 21 day EMA has become the new moving average for support.
- RSI remains high at 62.49 but there is room to move higher. The probability is on building more of a price base here and staying in a trading range.
- The MACD just had a bearish crossover.
- Mega caps, financials, and energy all held up strong last week and were for the first to go green on most down days. $DIA $XLF $XLE.
- Tech was week last week making lower lows. XLK QQQ
- No clues in volume last week as up and down days were very similar.
I am currently long small caps in a trend trade and holding $UWM. I am watching QQQ for a buy signal on a deeper dip near the 30 RSI or a 5 day / 20 day EMA bullish crossover.