This is a guest post from Kim Iskyan, publisher of Stansberry Churchouse Research, an independent investment research company based in Singapore and Hong Kong that delivers investment insight on Asia and around the world. This post originally posted at “This is when a “bargain” will just get cheaper” and is republished here with permission.
When you’re watching a stock’s price fall suddenly, it’s tempting to buy it right away. After all, it’s now “on sale.” But, that may end up being a “bargain” that will cost you more than you saved.
The investment world has the same advice your mother might have given you (had the situation arisen): “Never try to catch a falling knife.” For investors, that’s a warning to avoid buying a stock while its price is falling rapidly. Buying a plummeting stock could leave you bloodied – and poorer.
The adage endures because it captures a truth about investors. We are enticed by assets that suddenly (seemingly) become “bargains,” and we often regret buying too early, hurting ourselves as a consequence. (As I wrote recently, it helps to count to 10).
Behavioural biases help explain why investors make emotional decisions. With “anchoring,” people mentally “anchor” on a number or price when they make a decision.
When we assess the value of something, we seek a reference point for comparison. Unfortunately, we often choose insignificant or even random reference points – or we use one that we’re given. The anchoring bias causes us to rely too much on the first or most prominent piece of information as an anchor to determine value.
For example, let’s say you’re shopping for a new TV. You see one on sale for 50 percent off the original price. You “anchor” your decision based on the original price, and think 50 percent less is a great deal. But, that depends on whether the original price was reasonable in the first place.
What does this have to do with catching falling knives? A stock you’re following trades at around $50 for months, and then drops suddenly to $40. You might think the stock is a bargain, because you anchored the $50 price in your mind. That’s the same thinking as seeing the TV for 50 percent off… so you’d better buy now!
Unfortunately, in the world of investing prices that appear cheap now can become even cheaper.
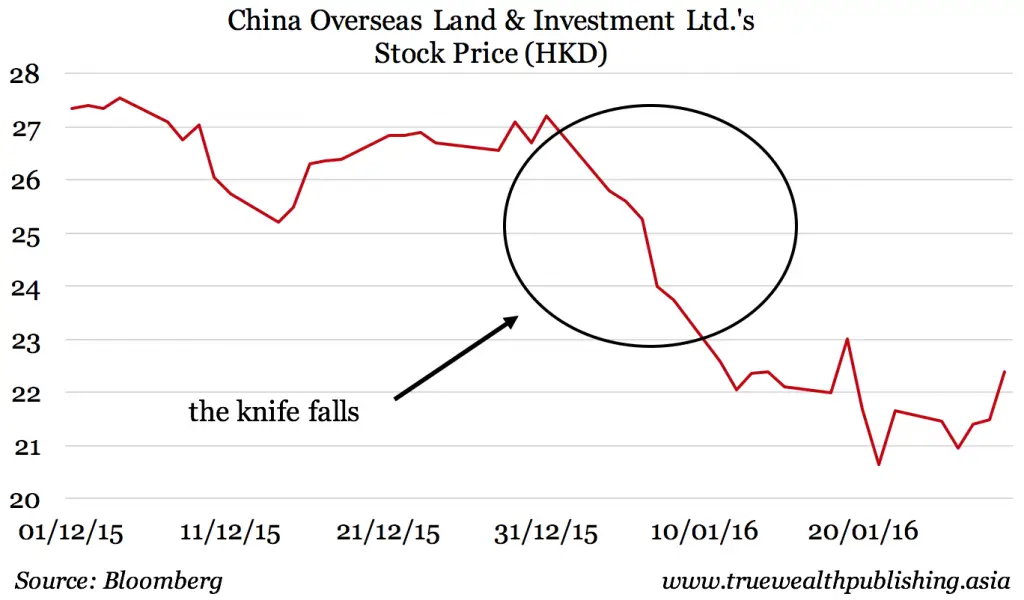
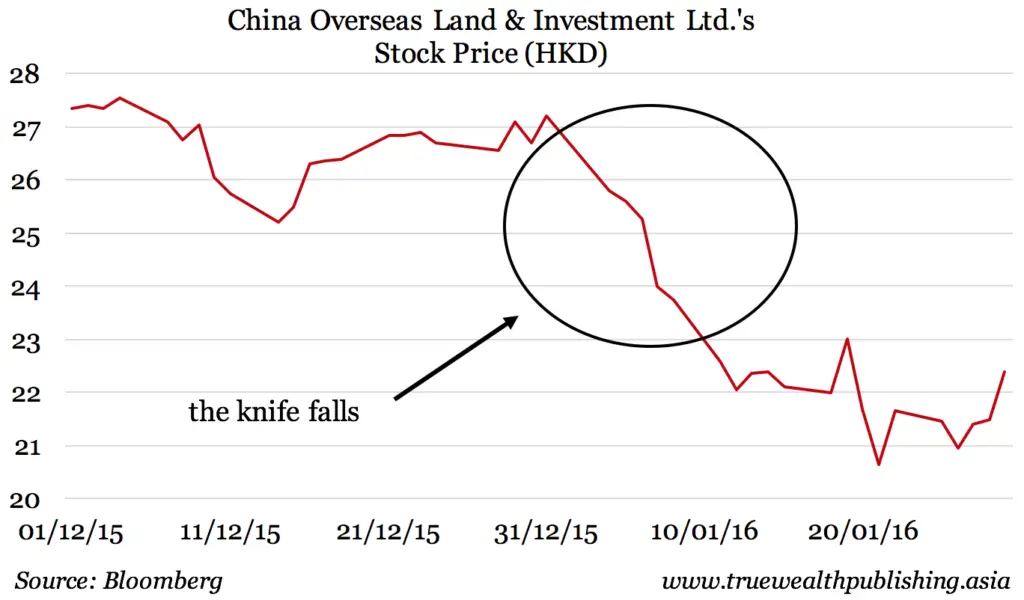
As an example, China Overseas Land & Investment shares (Hong Kong; code: 0688) began 2016 by falling sharply. On January 8, just five trading days into the year, the stock price had fallen over 12 percent from where it finished in 2015. Down five straight days, onJanuary 8 China Overseas was the proverbial “falling knife.”
The stock at HK$23.75 was “on sale” compared with its 2015 close of HK$27.25. However, an investor using that price as an anchor to determine value would have been bloodied. China Overseas Land didn’t bottom for nine more trading days, losing an additional 13 percent.
How might an investor in China Overseas Land have avoided being sliced by the falling stock? By stepping aside as the knife fell and simply waiting for the stock to reach the floor and its trend to turn higher.
There’s no need to rush and buy crashing stocks. It can take days, sometime months, for investors to absorb fully what’s going on, or for bad sentiment towards a stock to work itself out.
Pull out a long-term chart of your favourite stock or market. Highlight the times when the stock fell significantly over a short period. Notice that it’s rare for a stock to drop abruptly, then immediately go back up to where it was before. This process can take a while.
On a chart, long-term price reversals (when a stock price falls, then goes back up to where it was before the fall) rarely resemble a “V”. It is much more common for a stock price to show a “W” bottom. Technical analysts who study price charts for investment clues often watch for a “double bottom” as confirmation that a sell-off is over.
Another simple way to tell when a severe sell-off is over is when the stock’s 20-day moving average starts to turn up. The 20-day moving average is simply the average closing price of a stock over the previous 20 trading days. On price charts, the moving average is displayed as a line. If a stock falls abruptly, its average price of the past 20 days will be lower each day, and the 20-day moving average line on the chart will go down.
However, as the daily swings level off, the 20-day moving average line flattens. As the stock price gradually works higher, the moving average will turn higher, indicating that the trend has turned up.
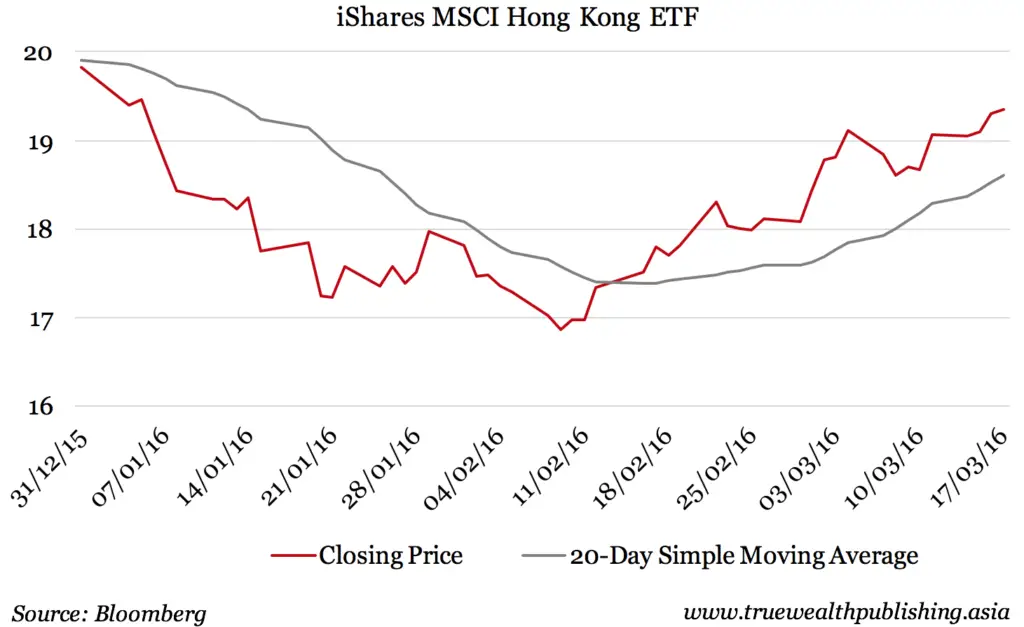
The MSCI Hong Kong ETF (New York; ticker: EWH) also began 2016 with a steep drop. But, if you tried to guess when the stock would stop falling in January, you would have lost even more money and dealt with gut-wrenching volatility.
By waiting for a double bottom (Feb. 11) and the 20-day moving average (grey line) to turn up (Feb. 16), an investor would have dodged the falling knife and been sitting on a nearly 10 percent profit.
There is nothing magical about a double bottom or waiting for the moving average to turn up. You still need to have a well-thought-out strategy. That includes entering a trailing stop to cut losses in case the stock price keeps falling. However, by waiting for these patterns to develop, one can avoid the anchoring bias and the temptation to chase plummeting prices.
As an investor, you don’t need the death-defying skills of a knife catcher. You just need patience and common sense.
This is a guest post from Kim Iskyan, publisher of Stansberry Churchouse Research, an independent investment research company based in Singapore and Hong Kong that delivers investment insight on Asia and around the world. You can also follow them on Twitter @stchresearch.


