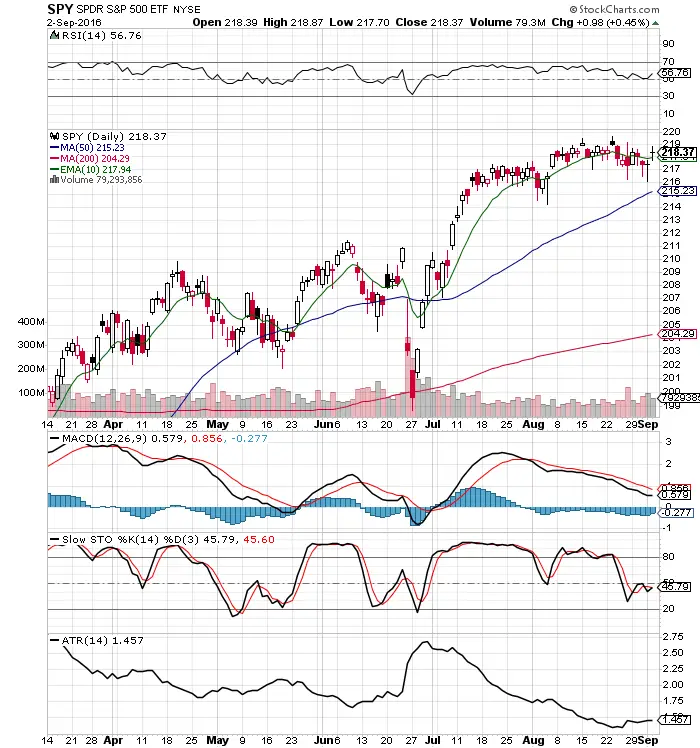
- $SPY continues to press all time highs which is bullish.
- With this price range buying the dip has been a more profitable trading strategy than buying momentum.
- Price is back over the 10 day EMA which is bullish.
- The 50 day SMA continues to be bullish and ascending.
- Slow Stochastics is neutral short term.
- The ATR has bottomed and is starting to expand. We may see a higher trading range next week.
- MACD continues to stay under a bearish crossover as the $SPY has lost momentum and started to go sideways.
- $XLF has a bullish chart which could be a good bullish indicator for $SPY.
- $IYT has a bullish chart that could be a leading indicator for $SPY.
- Volume has become about the same on both up and down days.
I am looking to buy dips in price next week and trading this range as the market is still leaning bullish.