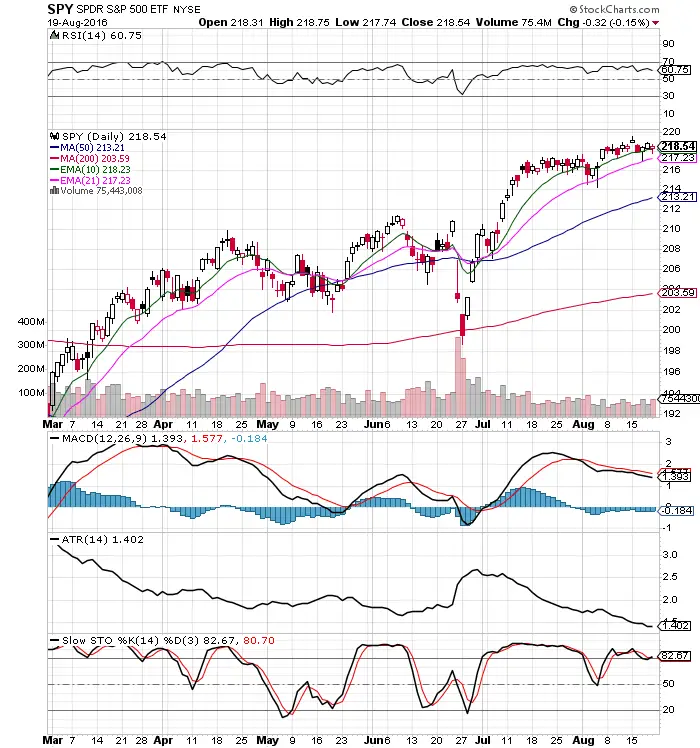
- This has been a dull bullish market with just a slow grind to new highs.
- The stock market is under tight consolidation inside a price range with no pressure on bulls to sell as $SPY creeps around all time high prices.
- $SPY is over all key moving averages but lacks momentum.
- All dips are bought quickly at the 10 day ema or the 21 day ema showing how many investors and traders are trying to get back in at every chance.
- RSI at 60.75 is bullish with room to go higher before becoming overbought
- Slow Stochatistic has given a short term buy signal.
- The ATR continues to go lower giving traders the green light to trade bigger position sizes with the low volatility.
- The MACD is under a bearish cross as there has not been enough momentum to push it to have a bullish crossover.
- Volume has become light and volume coming in could easily move this market in either direction next week.
- My strategy here is to buy the dips until the 70 RSI is reached, like it was last week.
I am currently long $SPY with size long term and long $SPXL short term. I am looking for a potential run to $225 and/or the 70 RSI, before a substantial pullback but I will be trading the price action. A close under the 10 day ema will give me cause for concern.