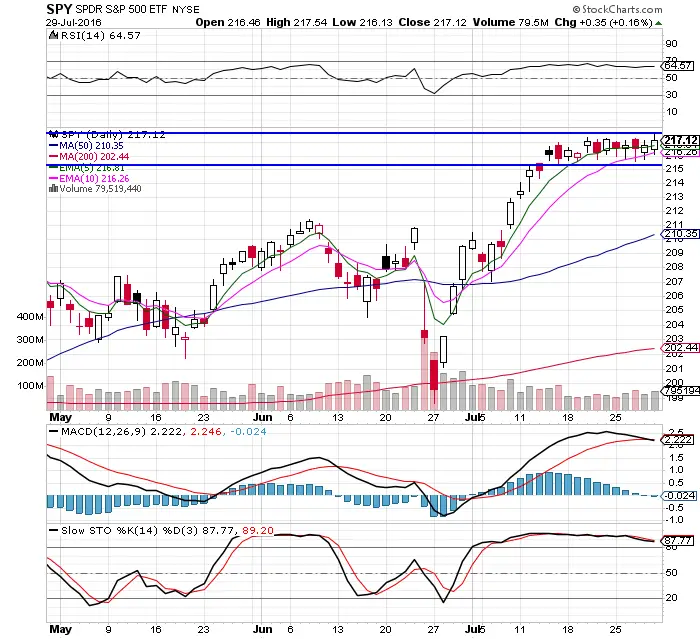
- $SPY has settled into a trading range with $217.50 as resistance and $215.50 as support for the past 12 trading days.
- The market is in a long term uptrend as new all time highs continue to be broken.
- The intermediate term risk/reward ratio favors a pullback to $215.50 before higher prices are made. Secondary support is $212 at the recent break out if there is a big pullback.
- RSI is bullish at 64.57 and has room to run to 70 RSI before becoming overbought.
- MACD is under a bearish pullback as the upside momentum of uptrend slows.
- Slow Stochastics is under a bearish cross.
- The Momentum in this market continues to be found in the tech sector with the leaders Facebook, Google, and Amazon but they are appear to be topping out in the short term.
- The current two week trading range in $SPY is the most narrow in 22 years.
- This market environment still favors buying the dip and also selling short overbought stocks for quick trades.
- Beware of trying to trade the first break out of this price range many times it takes several attempts to break out of resistance or support and trend. The more times that reistance or support or tested the greater the chance for a breakout.
I am currently short $QQQ via $SQQQ. I will be looking to sell $SPY short near the 70 RSI and sell $GOOGL short via buying puts if it rallies back to $800. I would also buy a $SPY dip to $215.50 for a quick trade.