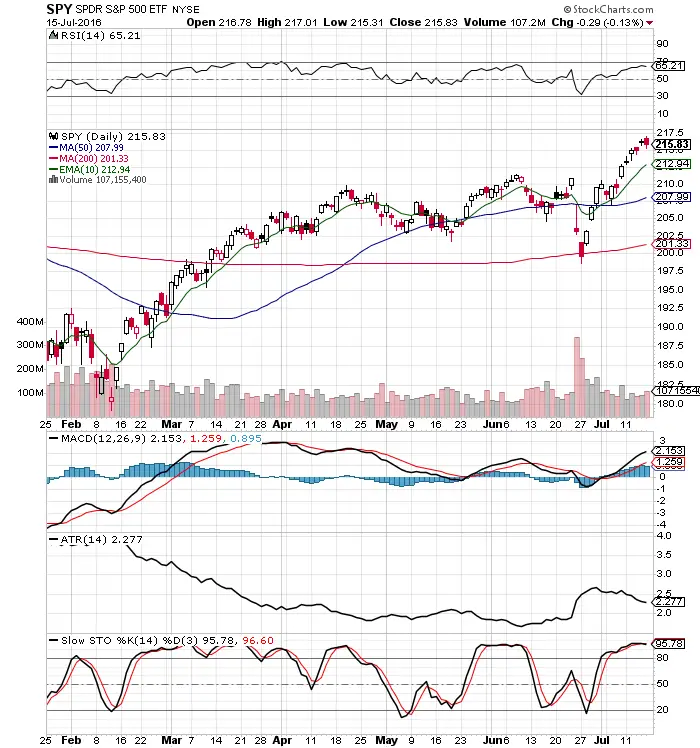
- $SPY is currently breaking out of a range into a new long term uptrend. Markets do not go straight up so look for a trading range to develop here before another strong up leg for price to new all time highs. It is possible we spend next week under this all time high.
- 65.21 RSI is near overbought. Not a good risk/reward ratio to enter longs so late in the uptrend here before a pullback.
- Price is extended by over one ATR over the 10 day EMA. The odds favor a pullback to the 10 day EMA this week.
- Slow Stochastics is under a bearish cross showing slowing momentum.
- MACD is still under an extreme bullish cross but is extended and late in the uptrend.
- $VIX at 12.67 is close to the lowest levels of 2016. It is probable that volatility spikes next week and the trading range expands.
- It will be very bullish if the market does not sell off on the failed Turkey coup.
- $SPY can advance +2 ATR and the 70 RSI before I get a sell short signal.
- This is a bull market in stocks with $GLD and $TLT finally going down.
- IPOs are all in strong uptrends over their 5 day EMA and 10 day EMA which is very bullish. $TWLO $ACIA
This is the type of market I find an edge in selling short near extreme oversold levels like the 70 RSI for small pullbacks or buy dips near the 10 day ema or the 50 RSI. I am looking to sell $DIA short next week into any rally higher or buy a deep dip on $SPY.