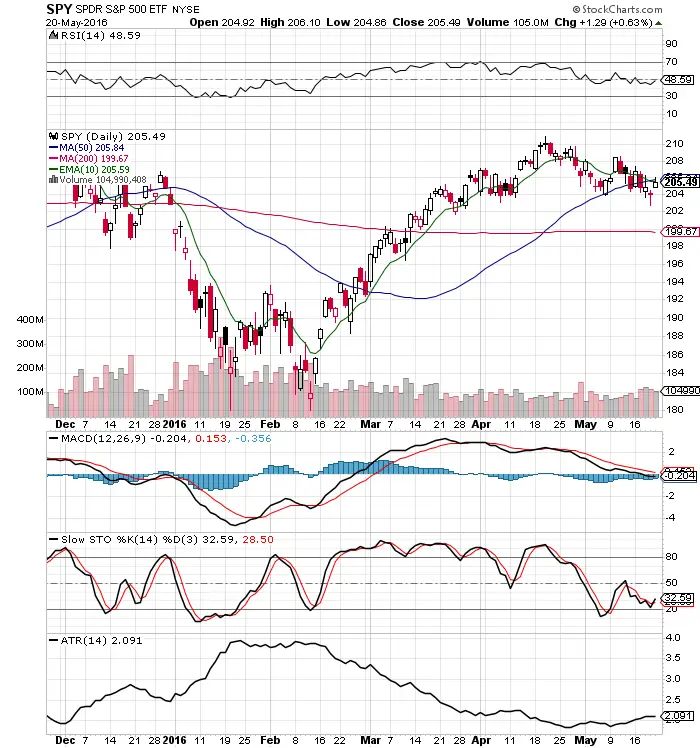
Still lots of mixed signals in $SPY price action going into next week. We appear to sill be range bound and looking for a breakout of this tight trading range. We are in the neutral zone of price action.
The bad news:
- $SPY price is still under all key moving averages: 10 day EMA and 50 day SMA.
- The MACD is still under a bearish cross.
- The RSI is still under the 50 RSI at 48.59.
- ATR increased slightly last week.
- $SPY rotated back and forth from up to down last week with no trend and a tight trading range.
The good news:
- $SPY had a Slow Stochastics bullish crossover on Friday showing the potential for a swing higher in price.
- The 200 day SMA is now sideways showing the market has settled into a trading range and not trending downwards.
- $SPY is in quick striking distance of all time highs in price.
- Thursday and Friday created a bullish reversal.
- The $202.50 short term support level held last week.
I will be looking to buy a deep dip next week if we get to the 30 RSI or buy a breakout over the key moving averages of the 10 day EMA.
Full disclosure: I am long $TWTR and $TNA going into Monday morning.