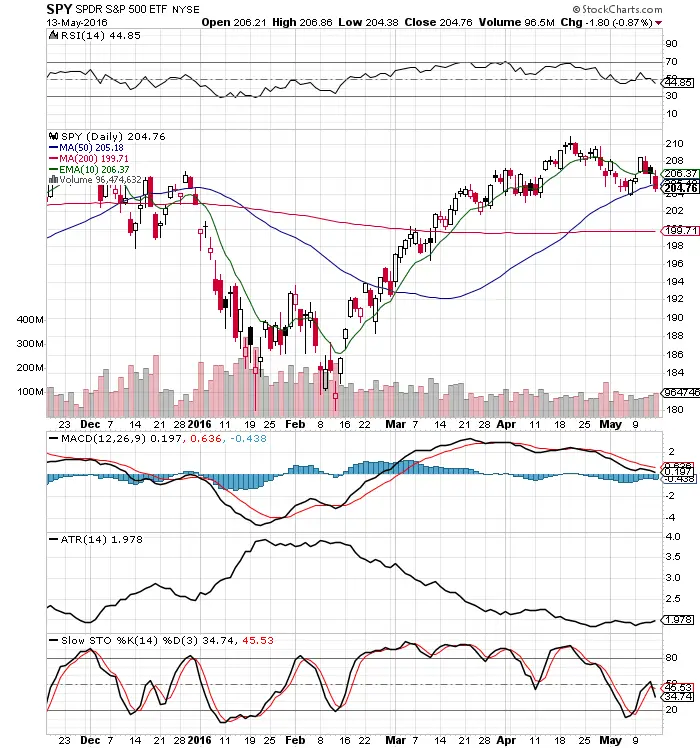
- Quite a wild ride in 2016 with $SPY having one of the fastest drops ever at the beginning of a year, followed by one of the fastest rallies, now we are back in a trading range since the April break out to new highs failed.
- This is not a buy momentum kind of market as rallies continue to stall under selling pressure.
- $SPY price is under the 10 day EMA. Short term $SPY is in downtrend.
- MACD is still under a bearish cross.
- Slow Stochastics is under a bearish cross as the bullish cross was quickly rejected last week.
- The ATR has flat lined on the chart showing more potential for sideways price action.
- The 44.85 RSI is the bear side of the chart with room to go lower.
- $SPY has turned sideways and is in trading range long term here.
- Recently the 50/200 day SMA death cross was near the recent market bottom and the 50/200 day golden cross was near the recent market top showing how range bound this market really is.
- VIX has been range bound here with $SPY a break out and close over a 16 VIX could be a warning of further downside on $SPY.
I am flat here on $SPY looking to buy near the 30 RSI dip if we get there. This is still a buy the dip and sell the rip kind of market.