Skip to content

 Chart Courtesy of StockCharts.com
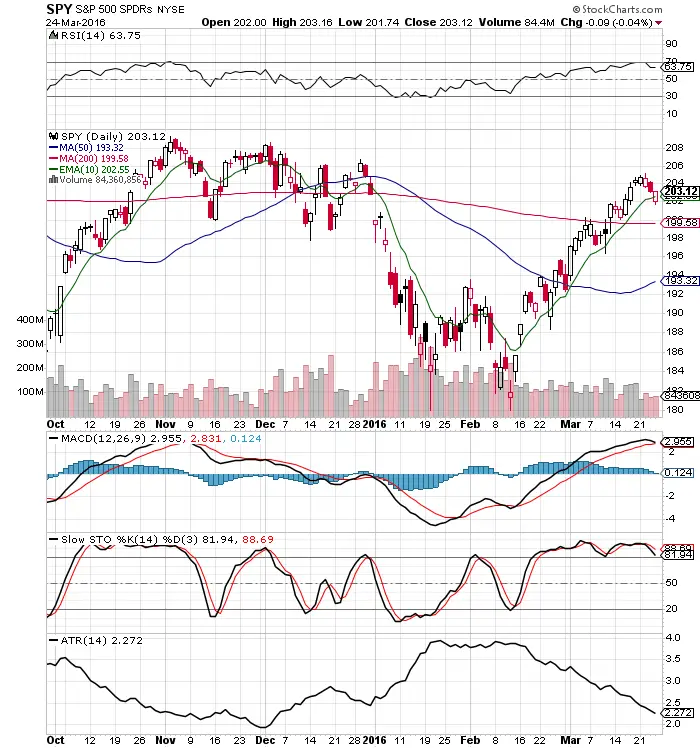
- $SPY continues to consolidate its price action. RSI was slightly overbought but bullish at 63.75 RSI.
- $SPY has closed over the 10-day EMA for 28 straight trading days. This is very bullish.
- The 50-day SMA has started to move upward. This is bullish.
- $SPY is over the 200-day SMA. This is bullish.
- MACD is still bullish, but could have a bearish cross over with another down day.
- Slow stochastic had a bearish crossover in the short term.
- The ATR continues to decline. This is bullish until it starts to increase.
- $SPY continues to be connected with oil prices. Oil seems to be consolidating in price.
- The $SPY pullback was on low volume for the last three trading days. This is what you would expect during an uptrend.
- Long term, the $SPY chart is still bullish. but it needs consolidation and could possibly pull back before the uptrend resumes.
